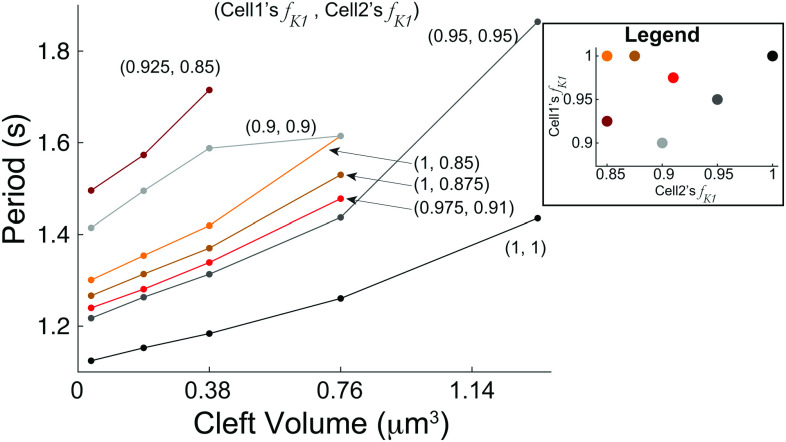
FIG. 8.
The period generally increases as the cleft volume increases for various combinations of fractions for cell 1 and 2 ( , ). Curves that abruptly end, which have less than five dots (e.g., top maroon curve ), indicate that automaticity is extinguished for larger . We considered five total values of . Note that we only show the case of no gap junction coupling ( ), as differences in period duration for values are negligible. Only cell-1’s period is shown, because in all cases, the period duration differences between cells 1 and 2 are less than a fraction of a millisecond.

