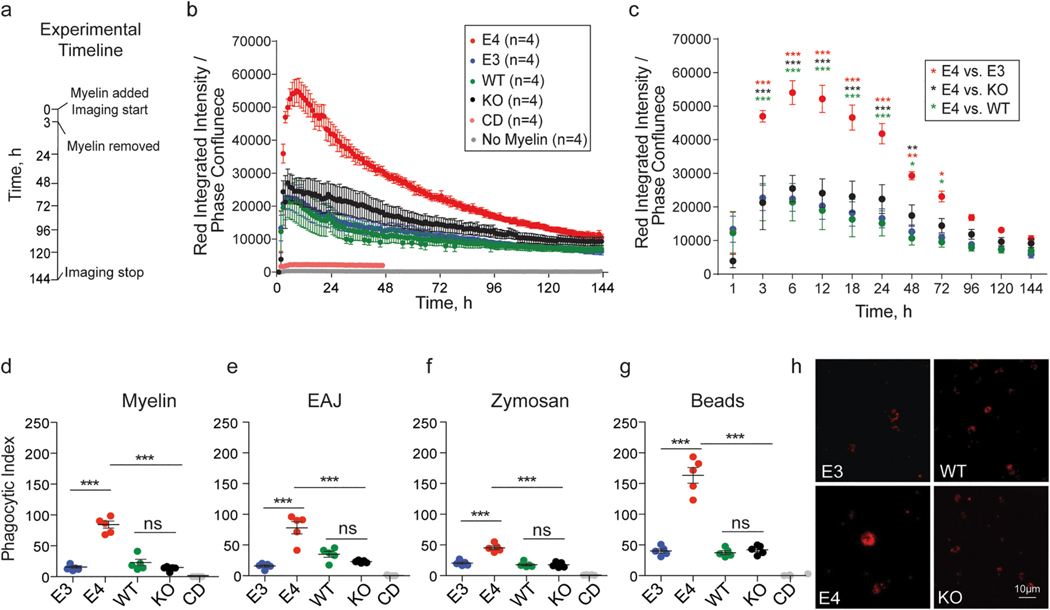
Fig. 2.
E4 microglia exhibit increased phagocytic uptake of diverse substrates. a) Experimental timeline: E3, E4, mouse Apoe (wild-type, WT), and homozygous null Apoe (KO) microglia were treated with substrate (or left untreated) for three hours. Imaging continued for up to six days. b) Red fluorescence was measured using the IncuCyte ZOOM live imaging system every hour. Integrated intensity of the red fluorescent signal [measured as red calibrated units (RCU) x μm2/image] was normalized to phase confluence to obtain a quantitative readout of red fluorescent substrate internalization. Cytochalasin D (CD) treatment in WT cells was used as a negative control. Mixed-effects analysis (restricted maximum likelihood as implemented in GraphPad Prism 9; fixed factors: time and genotype, random factor: experiment) identified a main effect of time F(1.7, 18.4) = 62.0, p = 3.1 × 10−07, a main effect of APOE genotype F(3,11) = 14.7, p = 0.0004, and an interaction between the two F(432, 1538) = 7.3, p = 1.7 × 10−187. c) Post-hoc t-tests at select time points identified significant differences (FDR adj. p-value = q < 0.05) between E4 microglia and microglia of other genotypes as early as 3 hours (E4 vs E3: q = 2.2 × 10−06, d = 3.7 CI95% [0.7, 6.6]; E4 vs KO: q = 1.1 × 10−06, d = 2.2 CI95% [0.3, 4.0], E4 vs WT, q = 2.6 × 10−06, d = 3.9 CI95% [1.1, 6.6]) and up to 72 hours (E4 vs E3: q = 0.001, d = 4.7 CI95% [1.7, 7.6], E4 vs KO, q = 0.1, d = 2.3 CI95% [0.4, 4.1], E4 vs WT, q = 0.03, d = 4.6 CI95% [1.4, 7.7]) post-treatment. d-g) Phagocytic index at 24 hours post-treatment was measured using flow cytometry (see Methods). pHrodo red-conjugated myelin: F(4, 20) = 80.1, p= 5.1 × 10⁻¹², E4 vs E3: adj. p = 1.8 × 10⁻¹⁰, d = 7.2 CI95% [3.5, 10.9], E4 vs KO: adj. p = 1.4 × 10⁻¹⁰, d = 7.4 CI95% [3.7, 11.2], E4 vs WT: adj. p = 1.4 × 10−09, d = 5.0 CI95% [2.3, 7.7]; early apoptotic Jurkat cells (EAJ): F(4, 20) = 33.4, p = 1.3 × 10−08, E4 vs E3: adj. p = 1.8 × 10⁻¹⁰, d = 3.9 CI95% [1.6, 6.1], E4 vs KO: adj. p = 1.4 × 10⁻¹⁰, d = 3.5 CI95% [1.4, 5.5], E4 vs WT: adj. p = 1.4 × 10−09, d = 2.5 CI95% [0.7, 4.1]; zymosan bioparticles: F(4, 20) = 64.2, p = 4.0 × 10⁻¹¹, E4 vs E3: adj. p = 2.0 × 10−07, d = 4.5 CI95% [2.0, 7.0], E4 vs KO: adj. p = 3.7 × 10−08, d = 5.0 CI95% [2.3, 7.7], E4 vs WT: adj. p = 4.4 × 10−08, d = 5.0 CI95% [2.2, 7.6]; red fluorescent carboxylate-modified polystyrene latex beads: F(4, 20) = 99.2, p = 6.8 × 10⁻¹³, E4 vs E3: adj. p = 8.6 × 10⁻¹¹, d = 5.9 CI95% [2.8, 9.0], E4 vs KO: adj. p = 1.1 × 10⁻¹⁰, d = 5.8 CI95% [2.7, 8.9], E4 vs WT: adj. p = 5.8 × 10⁻¹¹, d = 6.0 CI95% [2.9, 9.2]. h) Representative images of red fluorescent beads internalized 24 hours post-treatment. Scale bar 10μm. b-c) Each dot corresponds to the average of 3–5 independent experiments, error bars represent ± SE. d-g) One-way ANOVA followed by Tukey’s post-hoc corrected t-test. Each dot corresponds to an independent experiment (n = 5/group). Black horizontal bars indicate the mean and error bars represent SE. *p < 0.05, **p < 0.01, ***p < 0.001.

