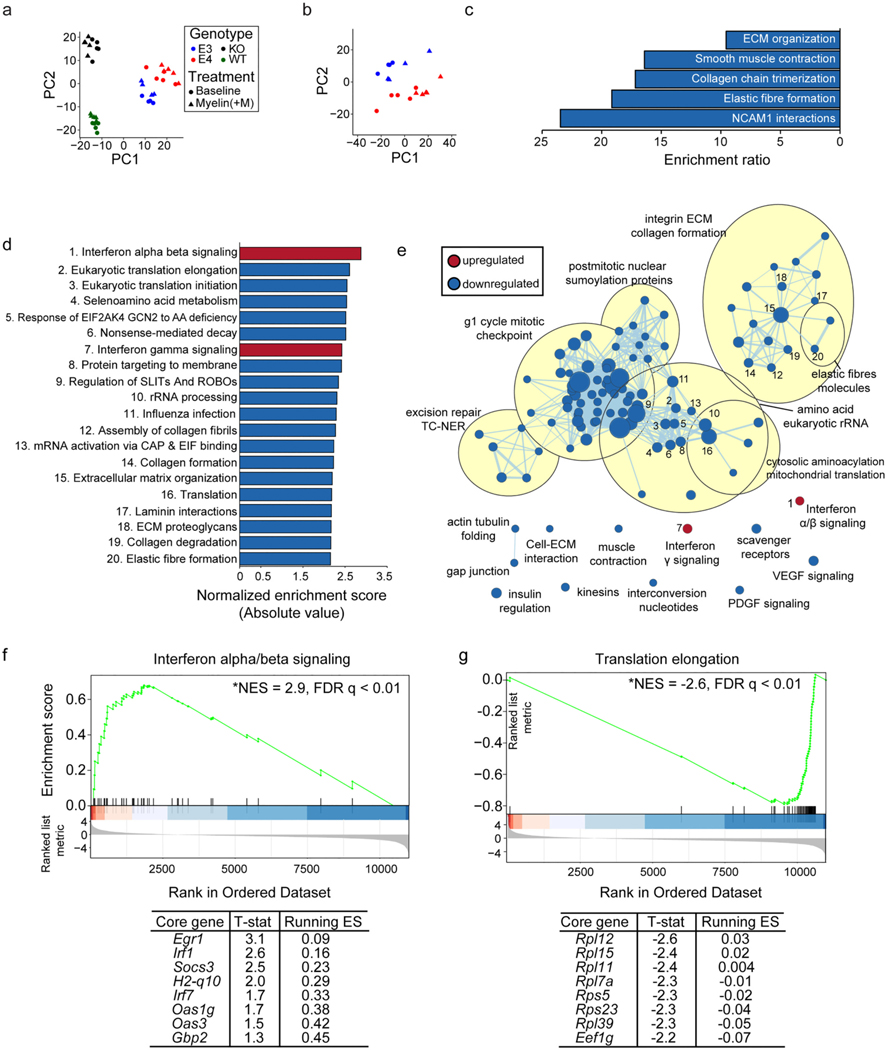
Fig. 4.
E4 microglia exhibit differential enrichment of genes in interferon signaling, extracellular matrix, and translation-related pathways at baseline. Principal component analysis (PCA) using the top 500 most variable genes from RNA-sequencing was performed using a) all samples or b) E3 and E4 samples only in order to examine clustering among samples. c) Reactome pathways significantly enriched (FDR adj. p-value < 0.05) for genes significantly downregulated (FDR adj. p-value < 0.05) in E4 vs E3 microglia, as identified by overrepresentation enrichment analysis performed using WebGestalt (Liao et al., 2019). d) The top 20 significantly enriched (FDR adj. p-value < 0.01) Reactome pathways enriched for genes differentially expressed in E4 vs E3 microglia, as identified by gene set enrichment analysis (GSEA) (Subramanian et al., 2005). e) Cytoscape Enrichment Map (Merico et al., 2010) and AutoAnnotate packages (Kucera et al., 2016) were used to identify relationships among all significantly enriched Reactome pathways (FDR adj. p-value < 0.01). Pathways enriched for upregulated genes are shown in red while pathways enriched for downregulated genes are shown in blue. Node size directly corresponds to the size of the plotted gene set. Edge width represents the number of genes that overlap between a pair of gene sets. Nodes corresponding to the top 20 pathways plotted in (d) are numbered appropriately. f) GSEA enrichment plot for “interferon alpha/beta signaling”, the most significantly enriched pathway at the top end of the ranked list (i.e., with a positive fold-change, see Methods). The mouse orthologues of the top 8 core genes identified by GSEA are listed below, along with the t-statistic of their differential expression and running enrichment score (ES) at their position. G) GSEA plot and list of core genes for “translation elongation”, the most significantly enriched pathway among genes at the bottom of the ranked list (i.e., with a negative fold change, see Methods). Detailed results are available in Table S3.

