Fig. 6.
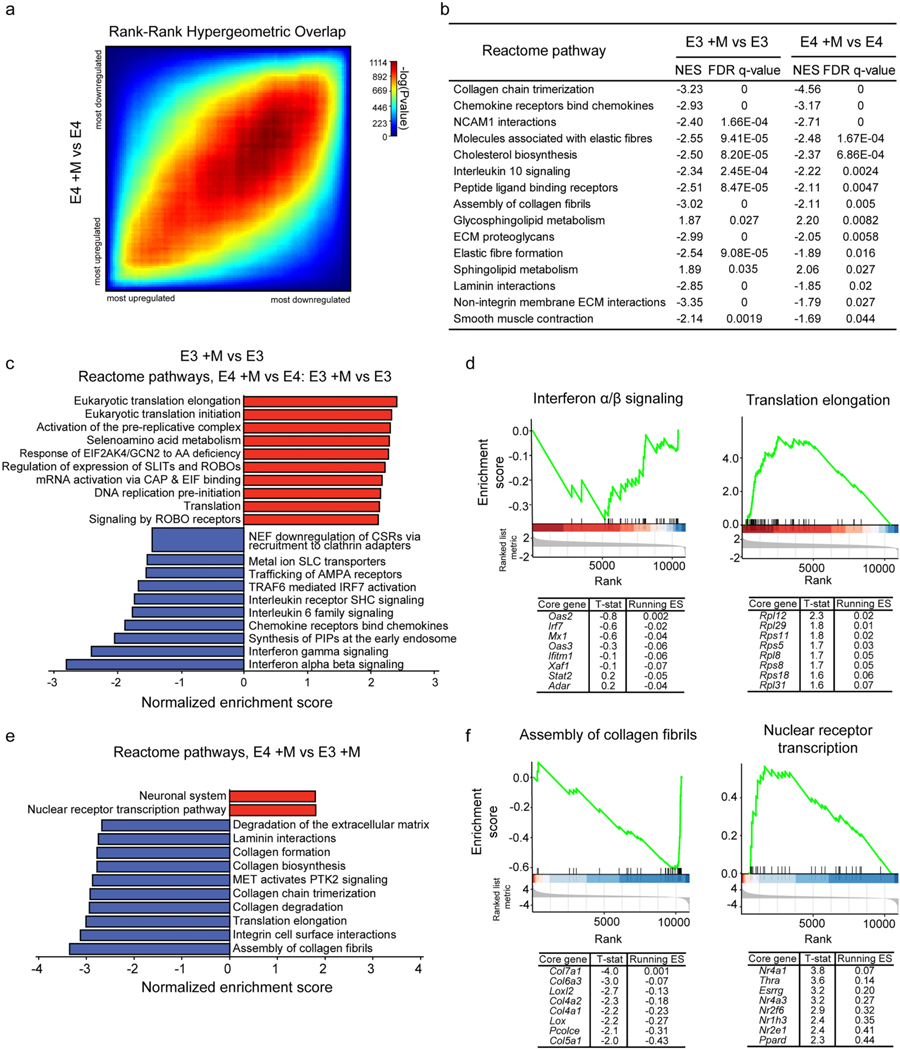
E4 and E3 microglia exhibit both shared and unique transcriptional responses to myelin challenge. a) Rank-rank hypergeometric overlap plot comparing the response of each genotype to myelin treatment (E4 +M vs E4 and E3 +M vs E3). b) GSEA-identified pathways significantly enriched (FDR adj. p-value < 0.05 and normalized enrichment score, NES, < −1.5 or > 1.5) in both comparisons. c) GSEA was performed on a ranked list generated from a two-factor differential gene expression analysis (E4 +M vs E3 +M relative to E4 vs E3) aimed at identifying genes for which expression changes in response to myelin challenge showed a significant interaction with APOE genotype. The top 10 pathways enriched for genes either at the top or bottom of the ranked list are plotted here. D) GSEA enrichment plots for “interferon alpha/beta signaling” and “translation elongation”, the most significantly enriched pathways at the bottom and top of the ranked list, respectively. The mouse orthologues of the top 8 core genes identified by GSEA are listed below, along with the t-statistic of their differential expression and running enrichment score (ES) at their position. e) GSEA was performed on the ranked list from one-factor differential gene expression analysis following myelin challenge (E4 +M vs E3 +M) and significantly enriched pathways (FDR adj. p-value < 0.25) were identified and plotted. f) GSEA enrichment plots and top core genes for the “assembly of collagen fibrils” and “nuclear receptor transcription” pathways as in (d). Detailed results available in Table S4 and Table S5.

