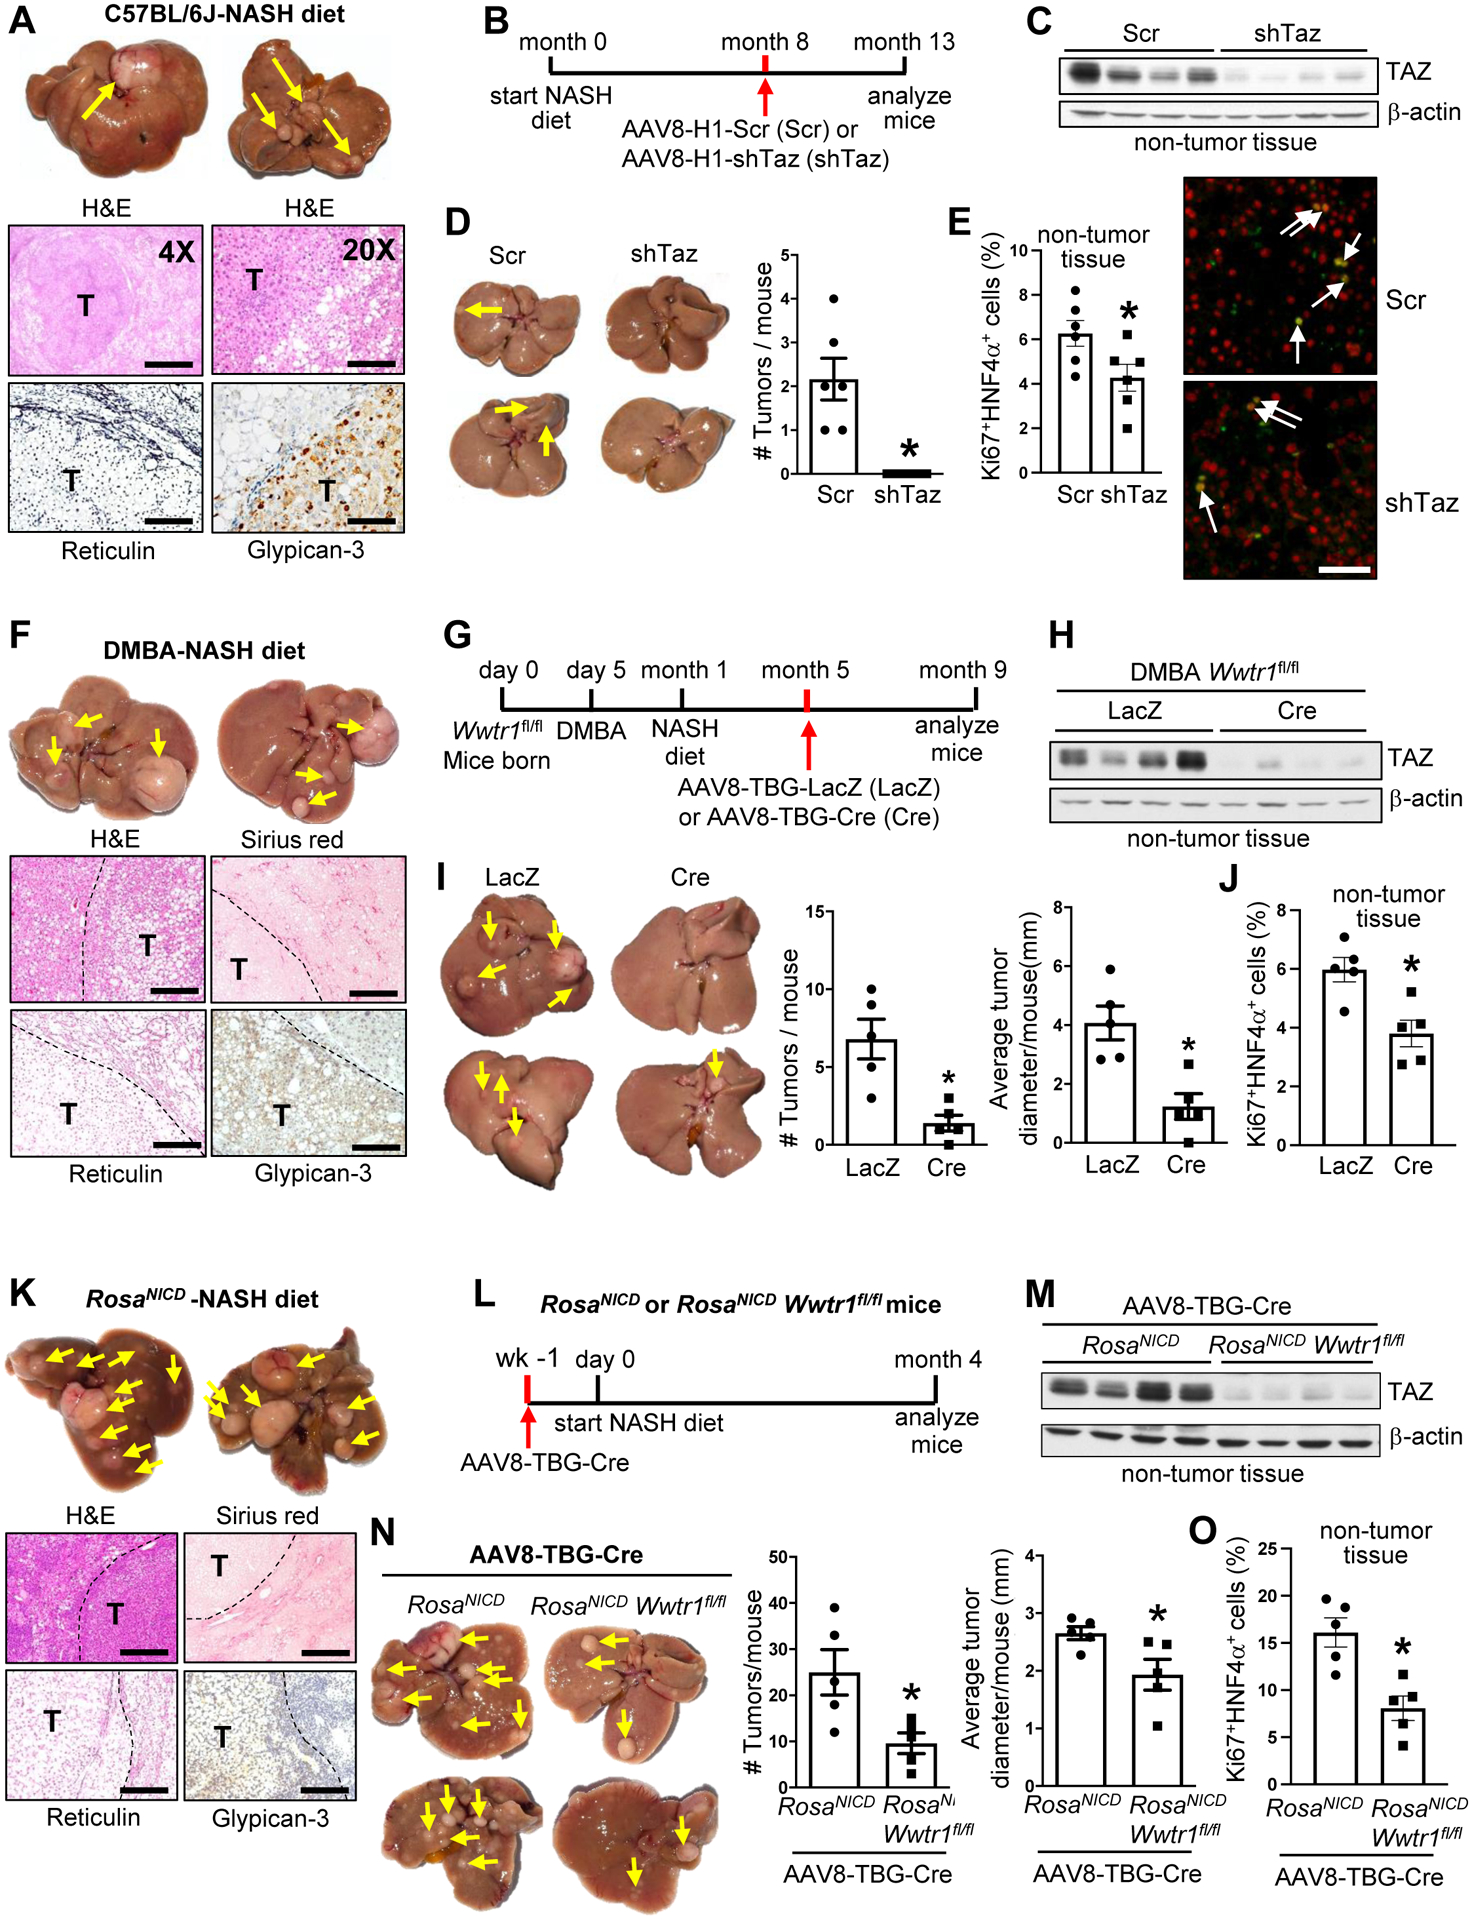
Figure 1. Silencing hepatocyte TAZ in pre-tumor NASH mice suppresses the development of HCC tumors.

(A) Livers (arrows, tumors) and liver sections of mice fed the NASH diet for 15 months. The sections were stained with H&E (imaged at 4X and 20X; bars, 1 mm and 200 μm, respectively; T, tumor) and with reticulin and ant-iglypican-3 (bars, 100 μm). (B-E) Mice were fed the NASH diet for 13 months, with AAV8-H1-shTaz (shTaz) or control vector (Scr) administered at 8 monts. (B) Experimental scheme. (C) TAZ immunoblot from non-tumor liver tissue. (D) Livers (arrows, tumors) and tumor numbers/mouse. (E) Liver sections from non-tumor areas stained for Ki67 (green) and HNF4α (red) and quantified for the percent Ki67+HNF4α+ cells (arrows, Ki67+HNF4α+ cells; bar, 100 μm). For D-E, n = 6 mice/group; means ± SEM; *p < 0.05 by Student’s t-test. (F) Livers (arrows, tumors) and liver sections of mice that were administered DMBA post-natal day 5; placed on NASH diet at 1 month of age, and analyzed at 9 months. The sections were stained with H&E, Sirius red (bars, 500 μm; T, tumor), reticulin, and anti-glypican-3 (bars, 200 μm). (G-J) Wwtr1fl/fl male mice were administered DMBA on postnatal day 5; placed on the NASH diet at 1 month; injected with AAV8-TBG-LacZ or AAV8-TBG-Cre at 5 months; and analyzed at 9 months. (G) Experimental scheme. (H) TAZ immunoblot from non-tumor liver tissue. (I) Livers (arrows, tumors) and tumor numbers and average diameter. (J) Percent Ki67+HNF4α+ cells in non-tumor areas. For I-J, n = 5 mice/group; means ± SEM; *p < 0.05 by Student’s t-test. (K) Livers (arrows, tumors) and liver sections of RosaNICD mice injected with AAV8-TBG-Cre to activate hepatocyte Notch; started on the NASH diet 1 week later; and analyed after 4 months on diet. The sections were stained with H&E, Sirius red (bars, 500 μm), reticulin, and anti-glypican-3 (bars, 200 μm). (L-O) RosaNICD or RosaNICD Wwtr1fl/fl mice were treated with AAV8-TBG-Cre; placed on NASH diet 1 week later; and analyzed 4 months later. (L) Experimental scheme. (M) TAZ immunoblot from non-tumor liver tissue. (N) Livers (arrows, tumors) and tumor numbers and average diameter. (O) Percent Ki67+HNF4α+ cells in non-tumor areas. For N-O, n = 5 mice/group; means ± SEM; *p < 0.05 by Student’s t-test.
