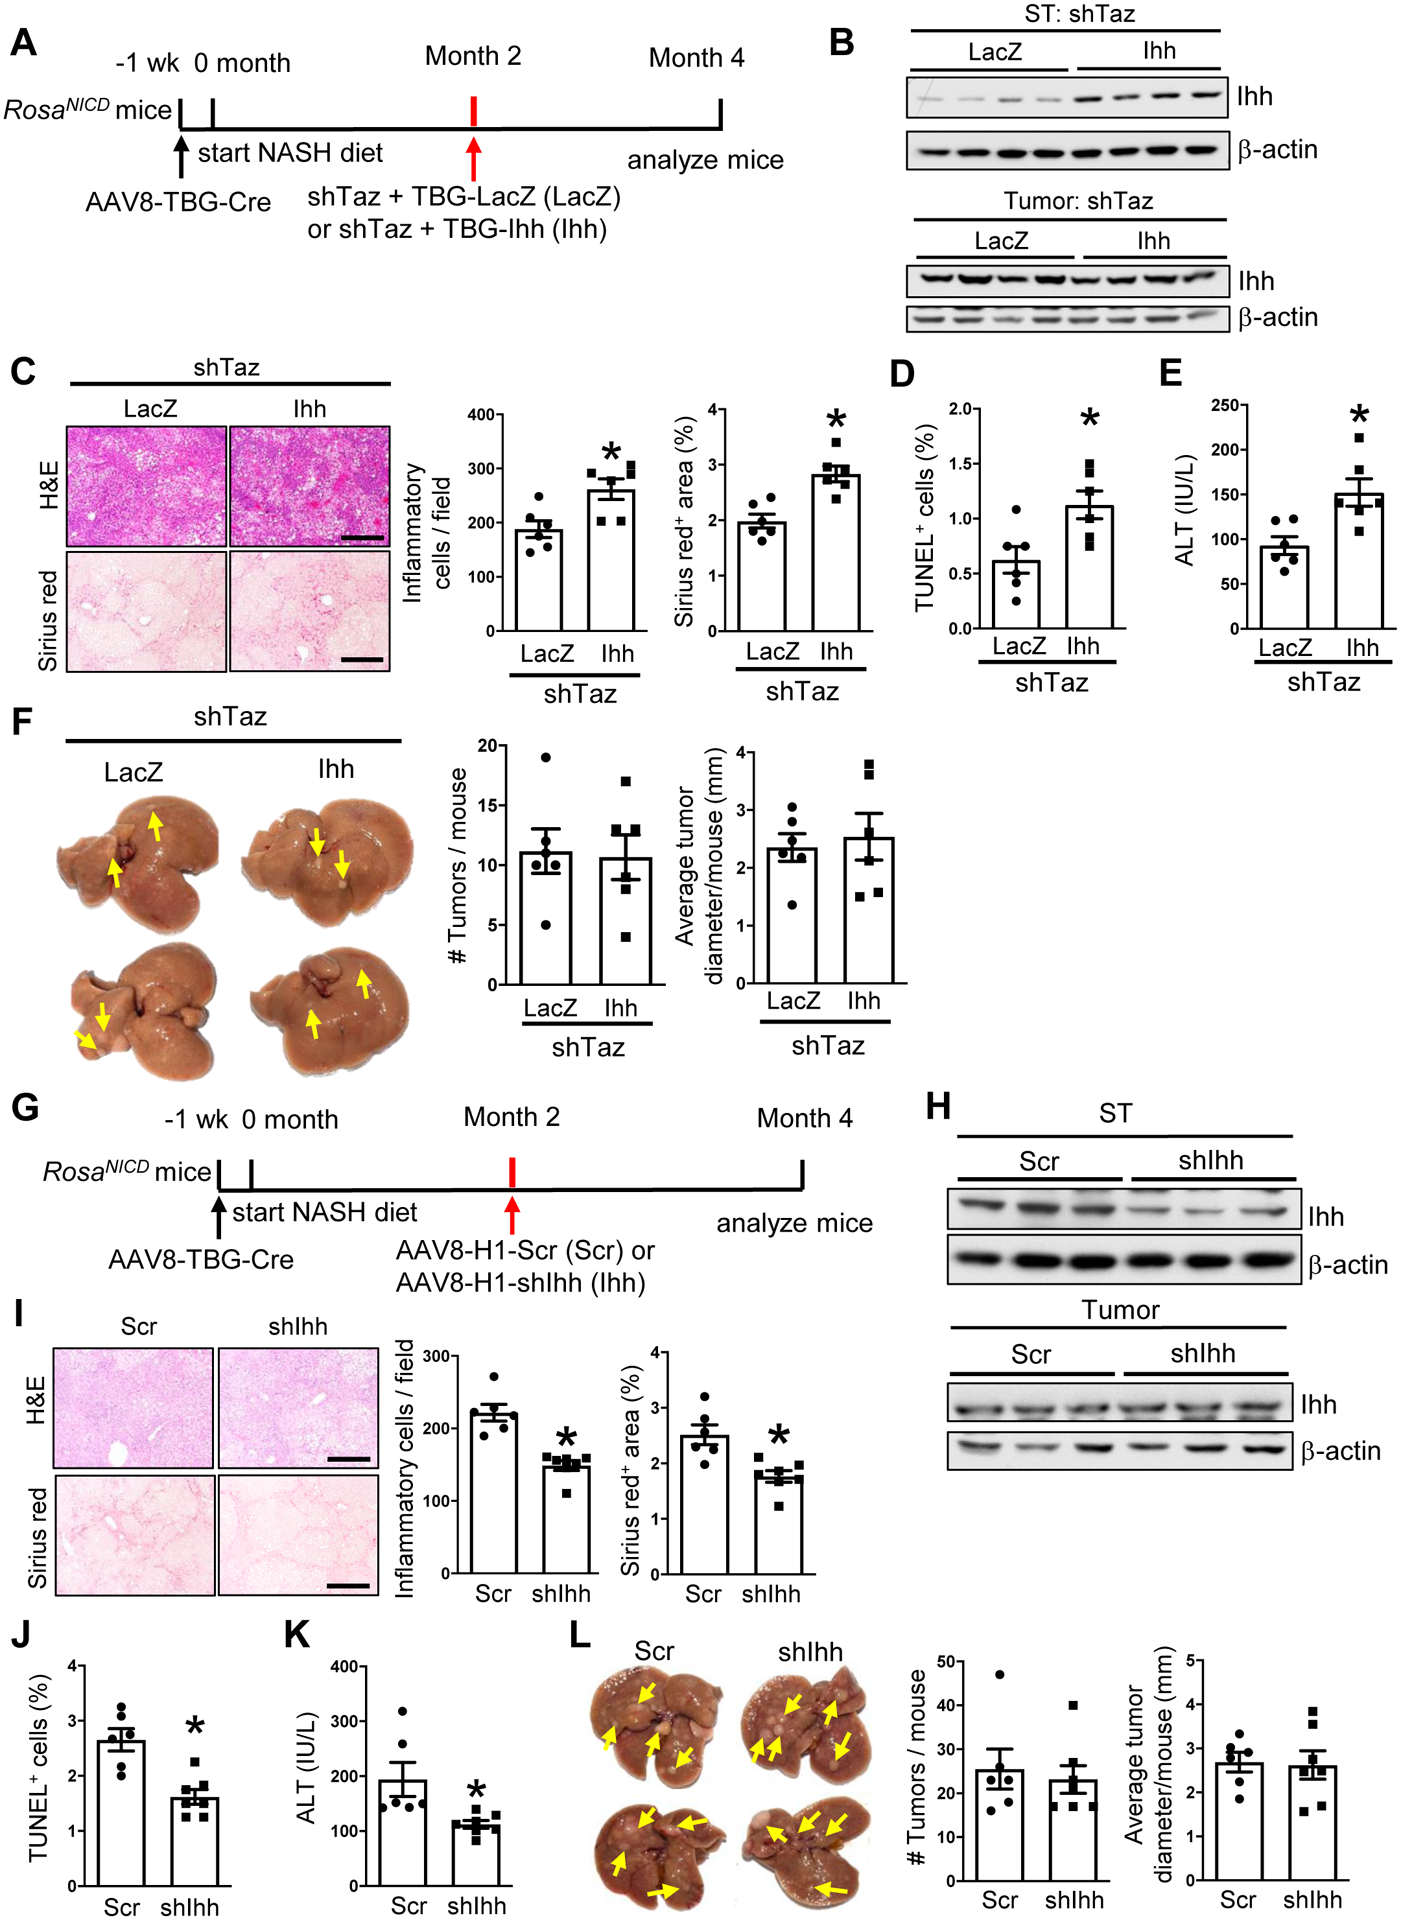
Figure 3. The tumor-suppressing effect of shTaz in experimental NASH-HCC can be dissociated from its NASH-suppressing effects.

(A-F) AAV8-TBG-Cre-treated RosaNICD mice were fed the NASH diet and, 2 months later, injected with AAV8-H1-shTaz and either AAV8-TBG-LacZ or AAV8-TBG-Ihh. The mice were analyzed at month 4. (A) Experimental scheme. (B) Ihh immunoblot from surrounding tissue (ST) and tumor tissue. (C) Liver sections stained with H&E (upper images) and Sirius red (lower images), with quantification of inflammatory cells and percent Sirius red-positive area. Bars, 200 μm. (D) Percent TUNEL+ cells from non-tumor areas. (E) Plasma ALT. (F) Livers (arrows, tumors) and tumor numbers and diameter. For C-F, n = 6 mice/group; means ± SEM; *p < 0.05 by Student’s t-test. (G-L) AAV8-TBG-Cre-treated RosaNICD mice were fed the NASH diet and, 2 months later, injected with AAV8-H1-Scr or AAV8-H1-shIhh. The mice were analyzed at month 4. (G) Experimental scheme. (H) Ihh immunoblot from surrounding tissue (ST) and tumor tissue. (I) Liver sections were stained with H&E (upper images) and Sirius red (lower images), with quantification of inflammatory cells and percent Sirius red-positive area. Bars, 200 μm. (J) Percent TUNEL+ cells from non-tumor areas. (K) Plasma ALT. (L) Livers (arrows, tumors) and tumor numbers and diameter. For I-L, n = 6–7 mice/group; means ± SEM; *p < 0.05 by Student’s t-test.
