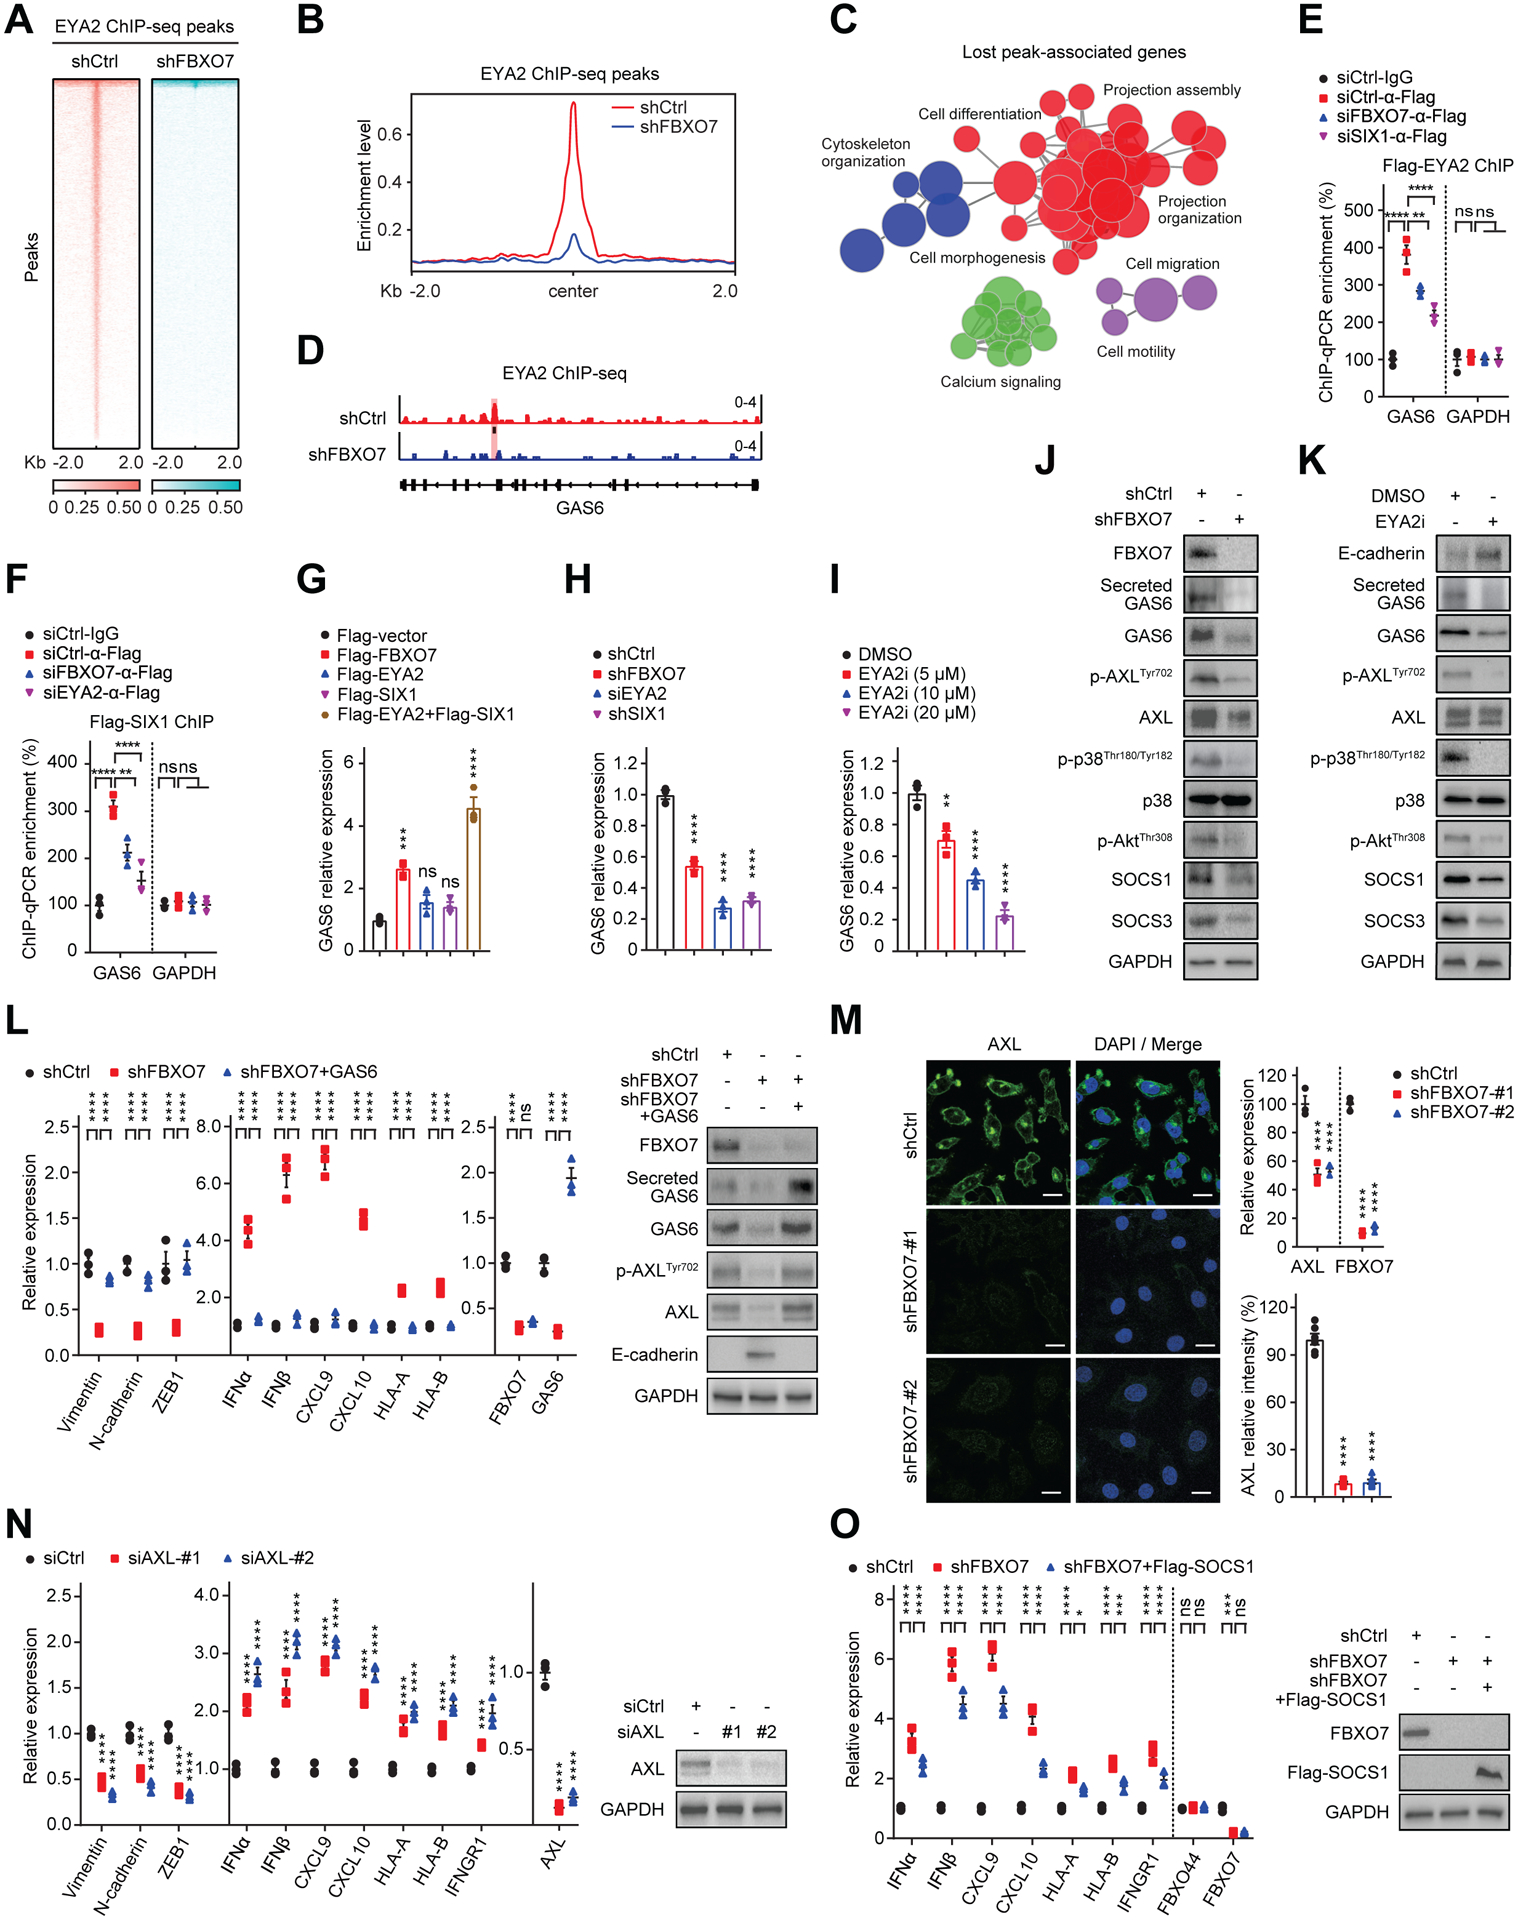
Figure 4. FBXO7 promotes EYA2/SIX1-mediated induction of AXL ligand GAS6.

(A) Heatmaps of EYA2 ChIP-seq signals in control and FBXO7 KD MDA-MB-231 cells. Signals +/− 2 kb of EYA2 peaks.
(B) ChIP-seq enrichment profiles of EYA2 peaks in control and FBXO7 KD MDA-MB-231 cells.
(C) Pathway enrichment map of significantly enriched gene sets in GSEA differentially bound by EYA2 in FBXO7 KD ChIP-seq.
(D) EYA2 binding Gas6 promoter (highlight) in control and FBXO7 KD MDA-MB-231 cells.
(E and F) ChIP analysis of Flag-EYA2 (E) and Flag-SIX1 (F) binding Gas6 promoter in MDA-MB-231 cells transfected with the indicated siRNAs (n = 3). GAPDH, control. ChIP performed with anti-Flag antibody. IgG, IP control.
(G to I) GAS6 expression in MCF7 cells transfected with indicated vectors (G) and MDA-MB-231 cells expressing indicated shRNAs (H) or treated with vehicle or EYA2i (I) (n = 3).
(J and K) Immunoblots of AXL signaling proteins in MDA-MB-231 cells transfected with control or FBXO7 siRNA (J) or treated with vehicle or EYA2i (K). GAPDH, loading control.
(L) RT-qPCR analysis of indicated genes in control, FBXO7 KD, and FBXO7 KD + GAS6 MDA-MB-231 cells (left panel). Immunoblots of indicated proteins (right panels). GAPDH, loading control.
(M) Representative IF images of AXL in control and FBXO7 KD MDA-MB-231 cells (left panels). DNA stained with DAPI (blue). Scale bar, 10 μm. Quantification of AXL (bottom, right panel). Six cells from 3 different fields (2 for each) were randomly chosen and quantified with ImageJ (n = 6). AXL expression (top, right panel) (n = 3).
(N) RT-qPCR analysis of indicated genes in control and AXL KD MDA-MB-231 cells (left panel) (n = 3). Immunoblots of indicated proteins (right panel). GAPDH, loading control.
(O) RT-qPCR analysis of indicated genes in control, FBXO7 KD, and FBXO7 KD + Flag-SOCS1 MDA-MB-231 cells (left panel) (n = 3). FBXO44, control. Error bars, SEM of n = 3. GAPDH, loading control.
Data represent mean ± SEM. ns, not significant; *p < 0.05; **p < 0.01; ***p < 0.001; ****p < 0.0001 by one-way ANOVA followed by Dunnett’s multiple comparisons test (G to I), Tukey’s multiple comparisons test (M, bottom, left panel), two-way ANOVA followed by Tukey’s multiple comparisons test (E, F, L, N, and O), and Sidak’s multiple comparisons test (M, top, right panel).
