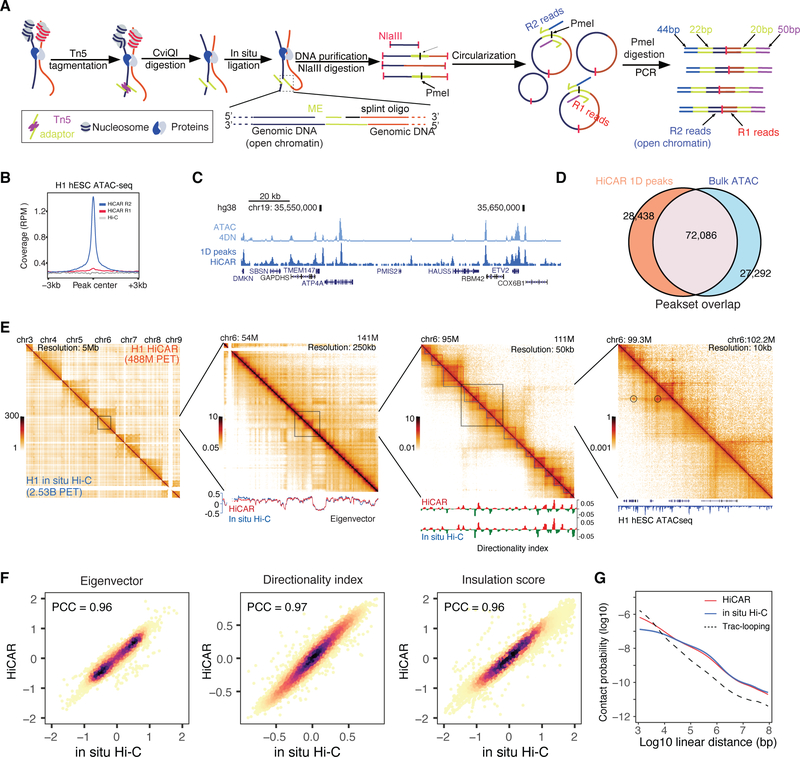
Figure 1. Overview of HiCAR experimental design.
(A) HiCAR workflow. The R2 reads of HiCAR libraries are derived from Tn5 insertion sites and can be used to call 1D open chromatin peaks. (B) The sequence depth normalized (reads per million, RPM) HiCAR R1 (red), R2 (blue) and in situ Hi-C (grey) reads was plotted as signal coverage surrounding +/− 3kb of each ATAC-seq peaks of H1 hESC. (C) A representative genome browser view showing the ATAC-seq data (top, light blue) and HiCAR R2 reads (bottom, dark blue) of H1 hESC. (D) Venn diagram showing overlap of MACS2 open chromatin peaks called from HiCAR R2 reads (orange) and ATAC-seq (blue) in H1 hESC. (E) H1 hESC chromatin contact matrices of HiCAR (above the diagonal) and in situ Hi-C (under the diagonal) at successive zoom-in views. Bottom tracks: the Eigenvector, Directionality index, and ATAC-seq track were plotted underneath the contact matrices as indicated. Color key: sequencing depth normalized reads counts (RPM). (F) Scatter plots comparing the Eigenvector, Directionality index, and Insulation score computed from HiCAR versus in situ Hi-C of H1 hESC. PCC: Pearson correlation coefficient. (G) Chromatin contact frequency (y-axis) was plotted as a function of linear genomic distance (x-axis) measured by HiCAR (red) and in situ Hi-C (blue) in H1 hESC and Trac-looping (dashed/black) in CD4 T cells. See also Figure S1, Figure S2, Table S1, and Table S3.

