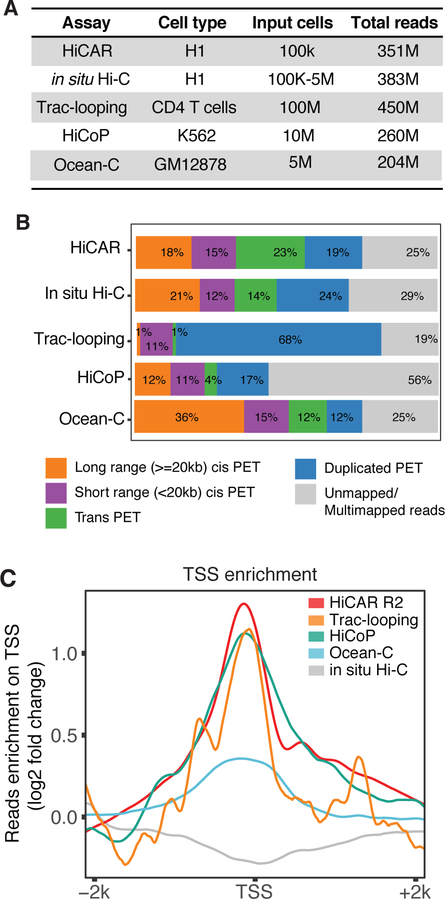
Figure 2. HiCAR outperforms existing methods to capture open chromatin anchored interactions.
(A) The number of input cells and the sequencing depth (total reads) of representative libraries of HiCAR, in situ Hi-C, Trac-looping, HiCoP, and Ocean-C. The representative H1 hESC in situ Hi-C data is obtained from 4DN data portal: 4DNFIYPLRRSZ. The Trac-looping, HiCoP, and Ocean-C data are obtained from previous studies (Lai et al., 2018; Zhang et al., 2020)(Li et al., 2018). (B) The percentage of PETs that are long range cis (>=20kb), short range cis (<20kb), trans (interchromosomal), PCR duplicates, and unmapped in the indicated dataset shown in (A). (C) The reads counts of HiCAR R2 (red), HiCoP (green), Ocean-C (blue), Trac-looping (orange), and in situ Hi-C (grey) are normalized against library sequence depth (counts per million), then aggregated within +/− 2kb window of human gene TSS. The fold change along the x-axis was calculated by comparing the reads counts of 100bp bin versus the mean reads counts of TSS +/− 2kb. See also Table S2 and Table S3.

