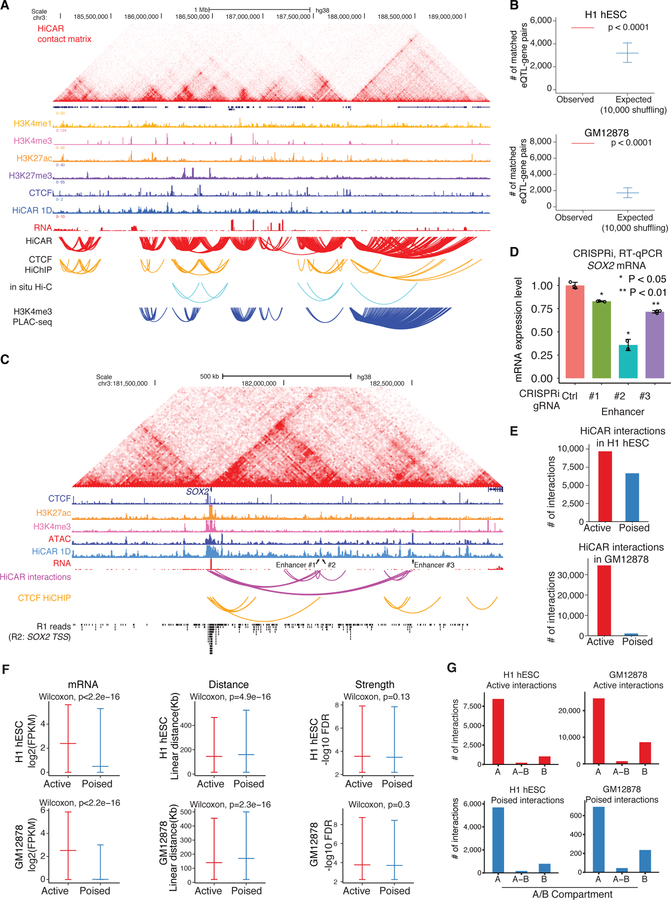
Figure 3. HiCAR is a robust and sensitive method to identify open chromatin anchored cRE interactions.
(A) HiCAR chromatin contact matrices are shown as heatmaps along with ChIP-seq tracks of H3K4me1, H3K4me3, H3K27ac, H3K27me3, CTCF; RNA-seq; and 1D open chromatin track derived from HiCAR R2 reads in H1 hESC. The arch tracks represent the chromatin loops and interactions called from HiCAR, CTCF HiChIP, H3K4me3 PLAC-seq, and in situ Hi-C as indicated. (B) The number of eQTL-gene pairs overlapping with observed HiCAR interactions (red), and (blue) randomly sampled pairwise DNA regions (10,000 times shuffling, with controlled linear genomic distance matching with HiCAR interactions distance) in H1 hESC (top) and GM12878 (bottom). One-sided empirical p-value <0.0001. (C) HiCAR contact matrix and indicated ChIP-seq, RNA-seq, and HiCAR 1D tracks surrounding SOX2 locus in H1 hESC. Arch tracks: H1 hESC HiCAR interactions (purple) and H9 hESC CTCF HiChIP interactions (yellow). The bottom track shows the aggregated R1 reads whose R2 reads overlap with the 2kb SOX2 transcription start site (TSS). The arrowheads point to enhancer #1 (chr3: 182,139,814–182,140,635), #2 (chr3: 182,143,023–182,143,349), and #3 (chr3: 182,500,129–182,500,831) for CRISPRi experiment shown in (D). (D) The sgRNAs were designed to recruit dCas9-KRAB to the candidate enhancers of SOX2 in H1 hESC. The non-targeting sgRNA was used as control. After CRISPRi, for each condition, three biological replicates were collected and SOX2 mRNA was analyzed by RT-qPCR. P values are calculated by a two-tailed Student’s t test. (E) The total number of active (red) and “poised” (blue) HiCAR interactions identified in H1 hESC (top) and in GM12878 (bottom). (F) We took the active (red) versus “poised” (blue) interactions identified from H1 hESC (top panels) and GM12878 (bottom panels) to compared: (left) the mRNA level (log2 transformed FPKM) of genes with promoters overlapping with anchors; (middle) the linear genomic distance between pairwise anchors; and (right). the interaction “strength” quantified by −log10 FDR (output from MAPS). The P values are calculated from the Wilcoxon rank-sum test. (G) We counted the number of active (top) versus “poised” (bottom) HiCAR interactions with their pairwise anchors located within the A, B, or across A-B compartments in H1 hESC (left) and GM12878 (right). See also Figure S3, Figure S4, Table S2, Table S3, and Table S4.

