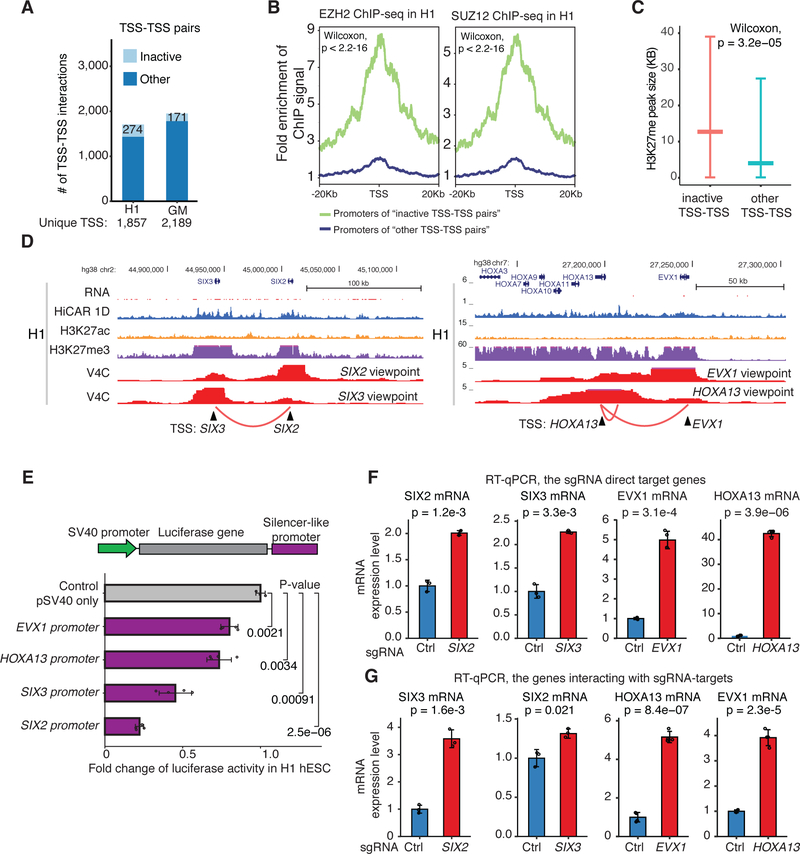
Figure 4. Promoters act as silencer-like elements of distal genes via promoter-promoter interactions.
(A) 1,706 and 1,950 TSS-TSS interactions are identified in H1 hESC and GM12878, respectively. These interactions include 274 and 171 interactions between the inactive gene promoters (light blue). The rest of TSS-TSS interactions are defined as “other” (dark blue). (B) We took the TSS from the “inactive” (green line) and “other” TSS-TSS pairs (blue line). from ach TSS. EZH2 (left) and SUZ12 (right) ChIP-seq signal centered +/− 20kb of the selected TSS was calculated. Fold change: ChIP-seq reads of every 100 bp bin was calculated by comparing to those of genome background 20kb away from TSS. Wilcoxon test P-value < 2.2e-16. (C) The size (kilobase, kb) of H3K27me peaks in H1 hESC overlapping with the “inactive” and “other” TSS defined in (A). Wilcoxon test P-value = 3.2e-05. (D) Genome browser screenshot illustrating the inactive TSS-TSS interactions between SIX3 and SIX2 promoters (left), and EVX1 and HOXA13 promoters (right) in H1 hESC cells. The genome browser tracks include virtual 4C (V4C), HiCAR interactions, ChIP-seq of H3K27ac and H3K27me3, HiCAR 1D open chromatin profile, and RNA-seq. (E) The genomic sequence corresponding to the promoters of EVX1, HOXA13, SIX3 and SIX2 was cloned downstream of the luciferase gene in pGL3-Promoter reporter construct. H1 hESC cells were transiently transfected, and whole cell extract was subjected to luciferase assay. The data was collected from three biological replicates. P-values: two-tailed Student’s t-test. (F, G) For CRISPRa experiments, H1 hESC were infected by lentiviral co-expressing VP64-dCas9-VP64 and sgRNAs targeting the promoters of SIX2, SIX3, EVX1, and HOXA13. The non-targeting sgRNA was used as negative control. H1 hESC infected by lentiviral were selected by Puromycin for 3 days. 10-days after infection, total RNA was extracted and subjected to RT-qPCR analysis to assess the mRNA levels of indicated genes. (F) mRNA changes of sgRNA direct target genes; (F) mRNA changes of the genes that are not directly targeted by sgRNA, but interacting with the promoters targeted by the sgRNAs. The data was collected from three biological replicates. P-values: two-tailed Student’s t-test. See also Figure S5, Table S4, and Table S4.

