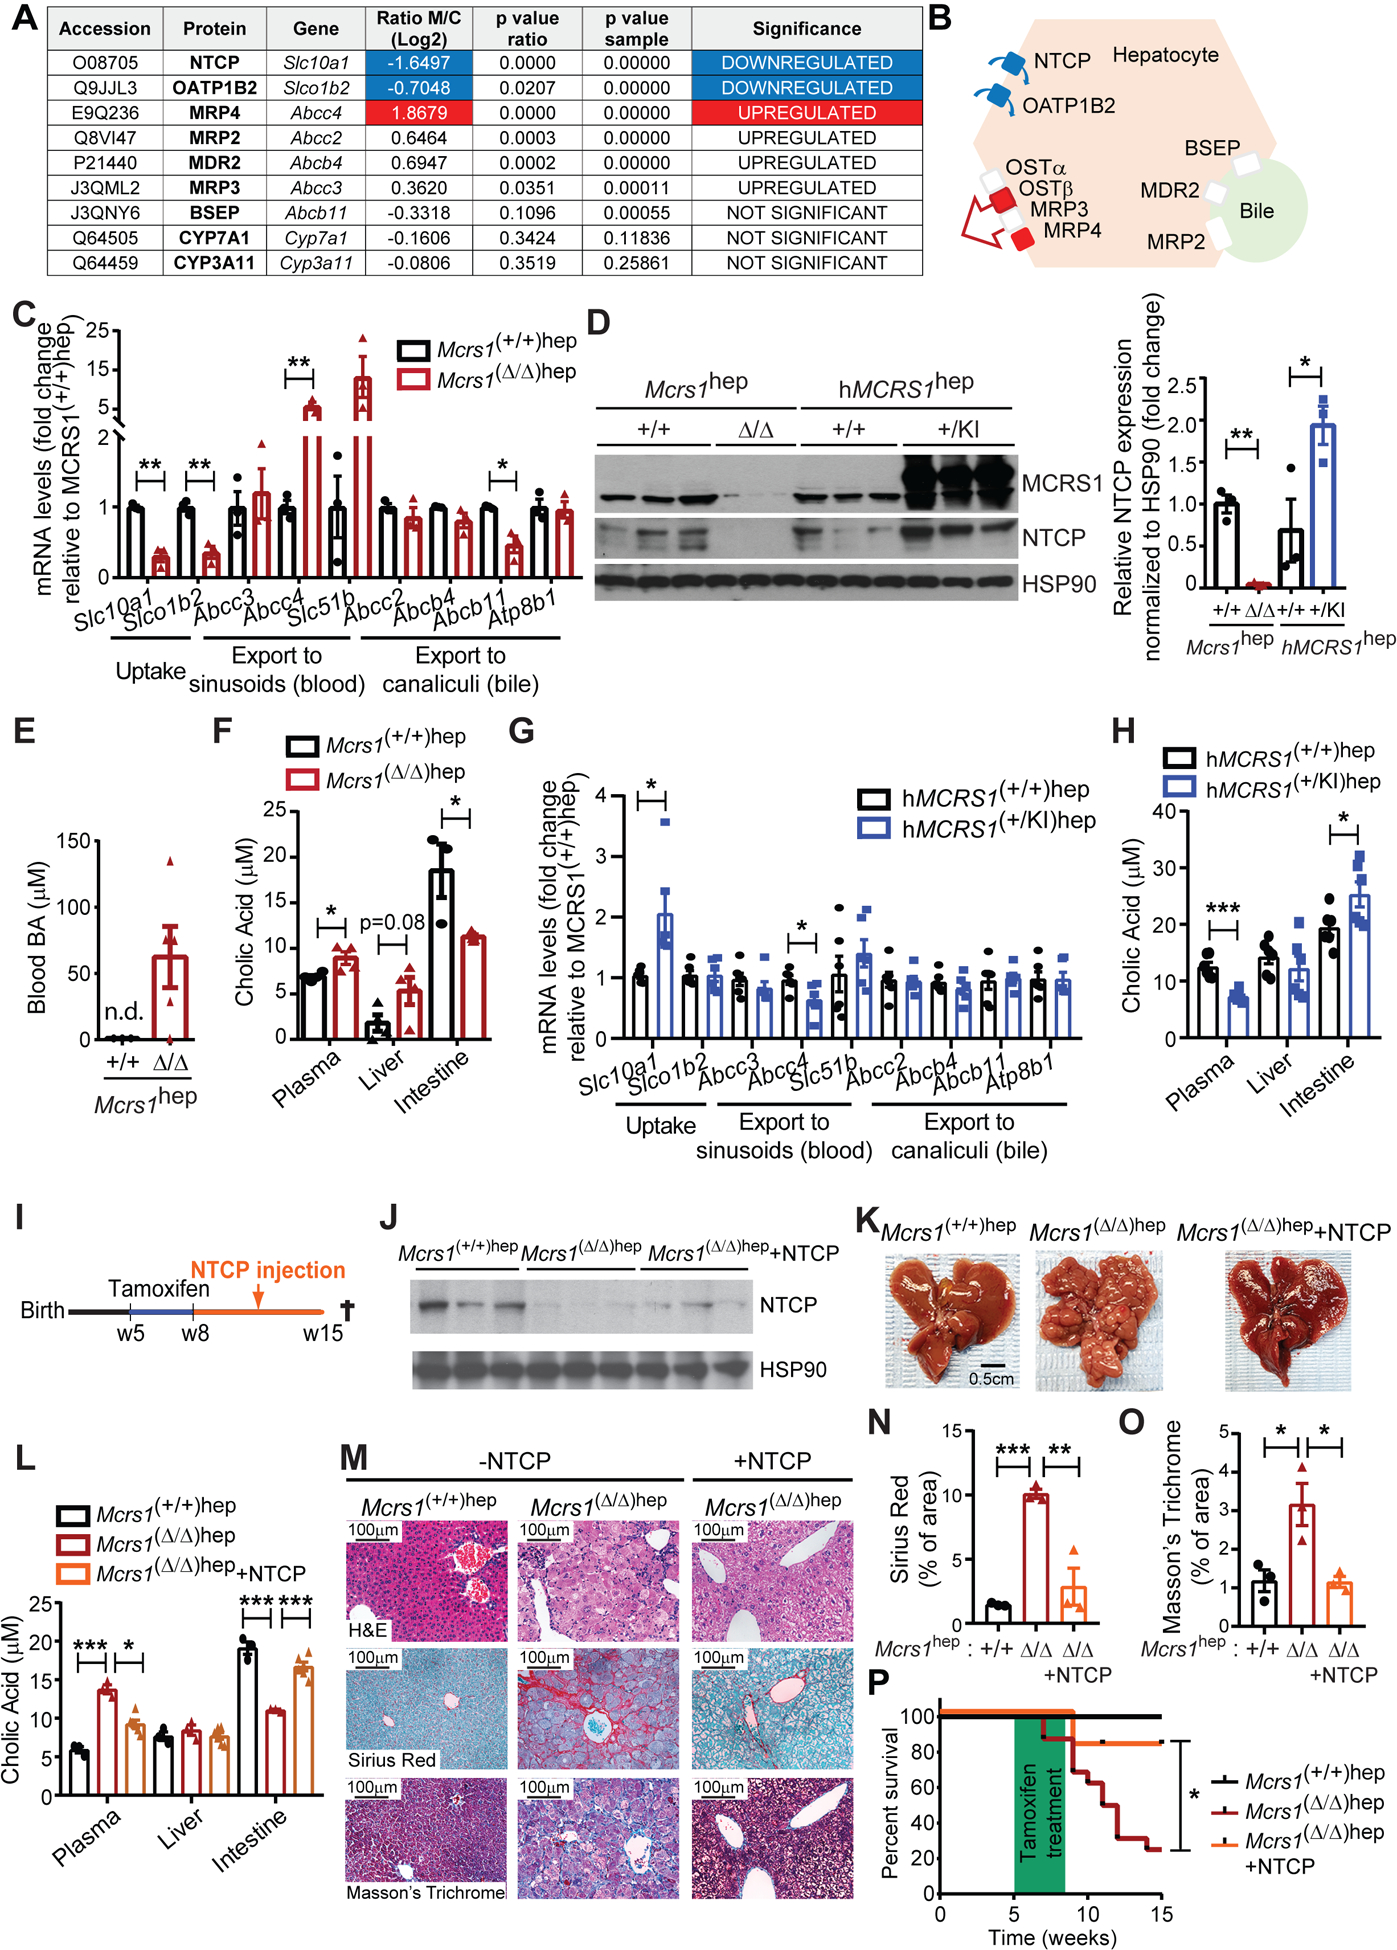
Fig. 2. Expression of BA transporters is deregulated in cirrhotic livers.

(A) Table representing relative BA-related protein levels detected by iTRAQ in livers from 8-week-old Mcrs1(Δ/Δ)hep mice compared to Mcrs1(+/+)hep mice (n=4). (B) Schematic representation of the location and expression status of BA transporters in the hepatocyte. Red means upregulated and green means downregulated. (C) Relative mRNA levels of BA transporters of hepatocytes isolated from 8-week-old Mcrs1(+/+)hep and Mcrs1(Δ/Δ)hep mice (n=3). (D) WB of isolated hepatocytes from 8-week-old Mcrs1(+/+)hep, Mcrs1(Δ/Δ)hep, hMCRS1(+/+)hep and hMCRS1(+/KI)hep mice. (E) Blood BA levels from 8-week-old Mcrs1(+/+)hep and Mcrs1(Δ/Δ)hep mice (n=3,5). (F) Cholic acid levels in plasma (n=4), liver (n=4) and intestine (n=3,5) from 8-week-old Mcrs1(+/+)hep and Mcrs1(Δ/Δ)hep mice. (G) Relative mRNA levels of BA transporters of hepatocytes isolated from 8-week-old hMCRS1(+/+)hep and hMCRS1(+/KI)hep mice (n=6). (H) Cholic acid levels in plasma, liver and intestine from 8-week-old hMCRS1(+/+)hep and hMCRS1(+/KI)hep mice (n=6). (I) Schematic representation of 5-week-old NTCP-overexpressing Mcrs1hep mice. (J) WB of isolated hepatocytes from the mice described in (I). (K) Representative pictures of livers from the mice described in (I). (L) Cholic acid levels in plasma, liver and intestine from mice described in (I) (n=3,3,6). (M) Representative pictures of indicated stainings of livers from mice described in (I). (N) and (O) Quantification of Sirius Red (N) and Masson’s Trichrome (O) stainings described in (M) (n=3). (P) Survival of mice described in (I) (n=5,16,11). Scale bar: 0.5 cm in (K), and 100 μm in (M). Statistical analysis was performed using unpaired two-tailed Student’s t test in (C), (D) and (F) to (H), two-way ANOVA with Tukey’s multiple comparisons test in (L), (N) and (O), and Mantel-Cox test in (P). n.d. means not detected. Data are represented as means±SEM. *, p≤0.05; **, p≤0.01; ***, p≤0.001.
