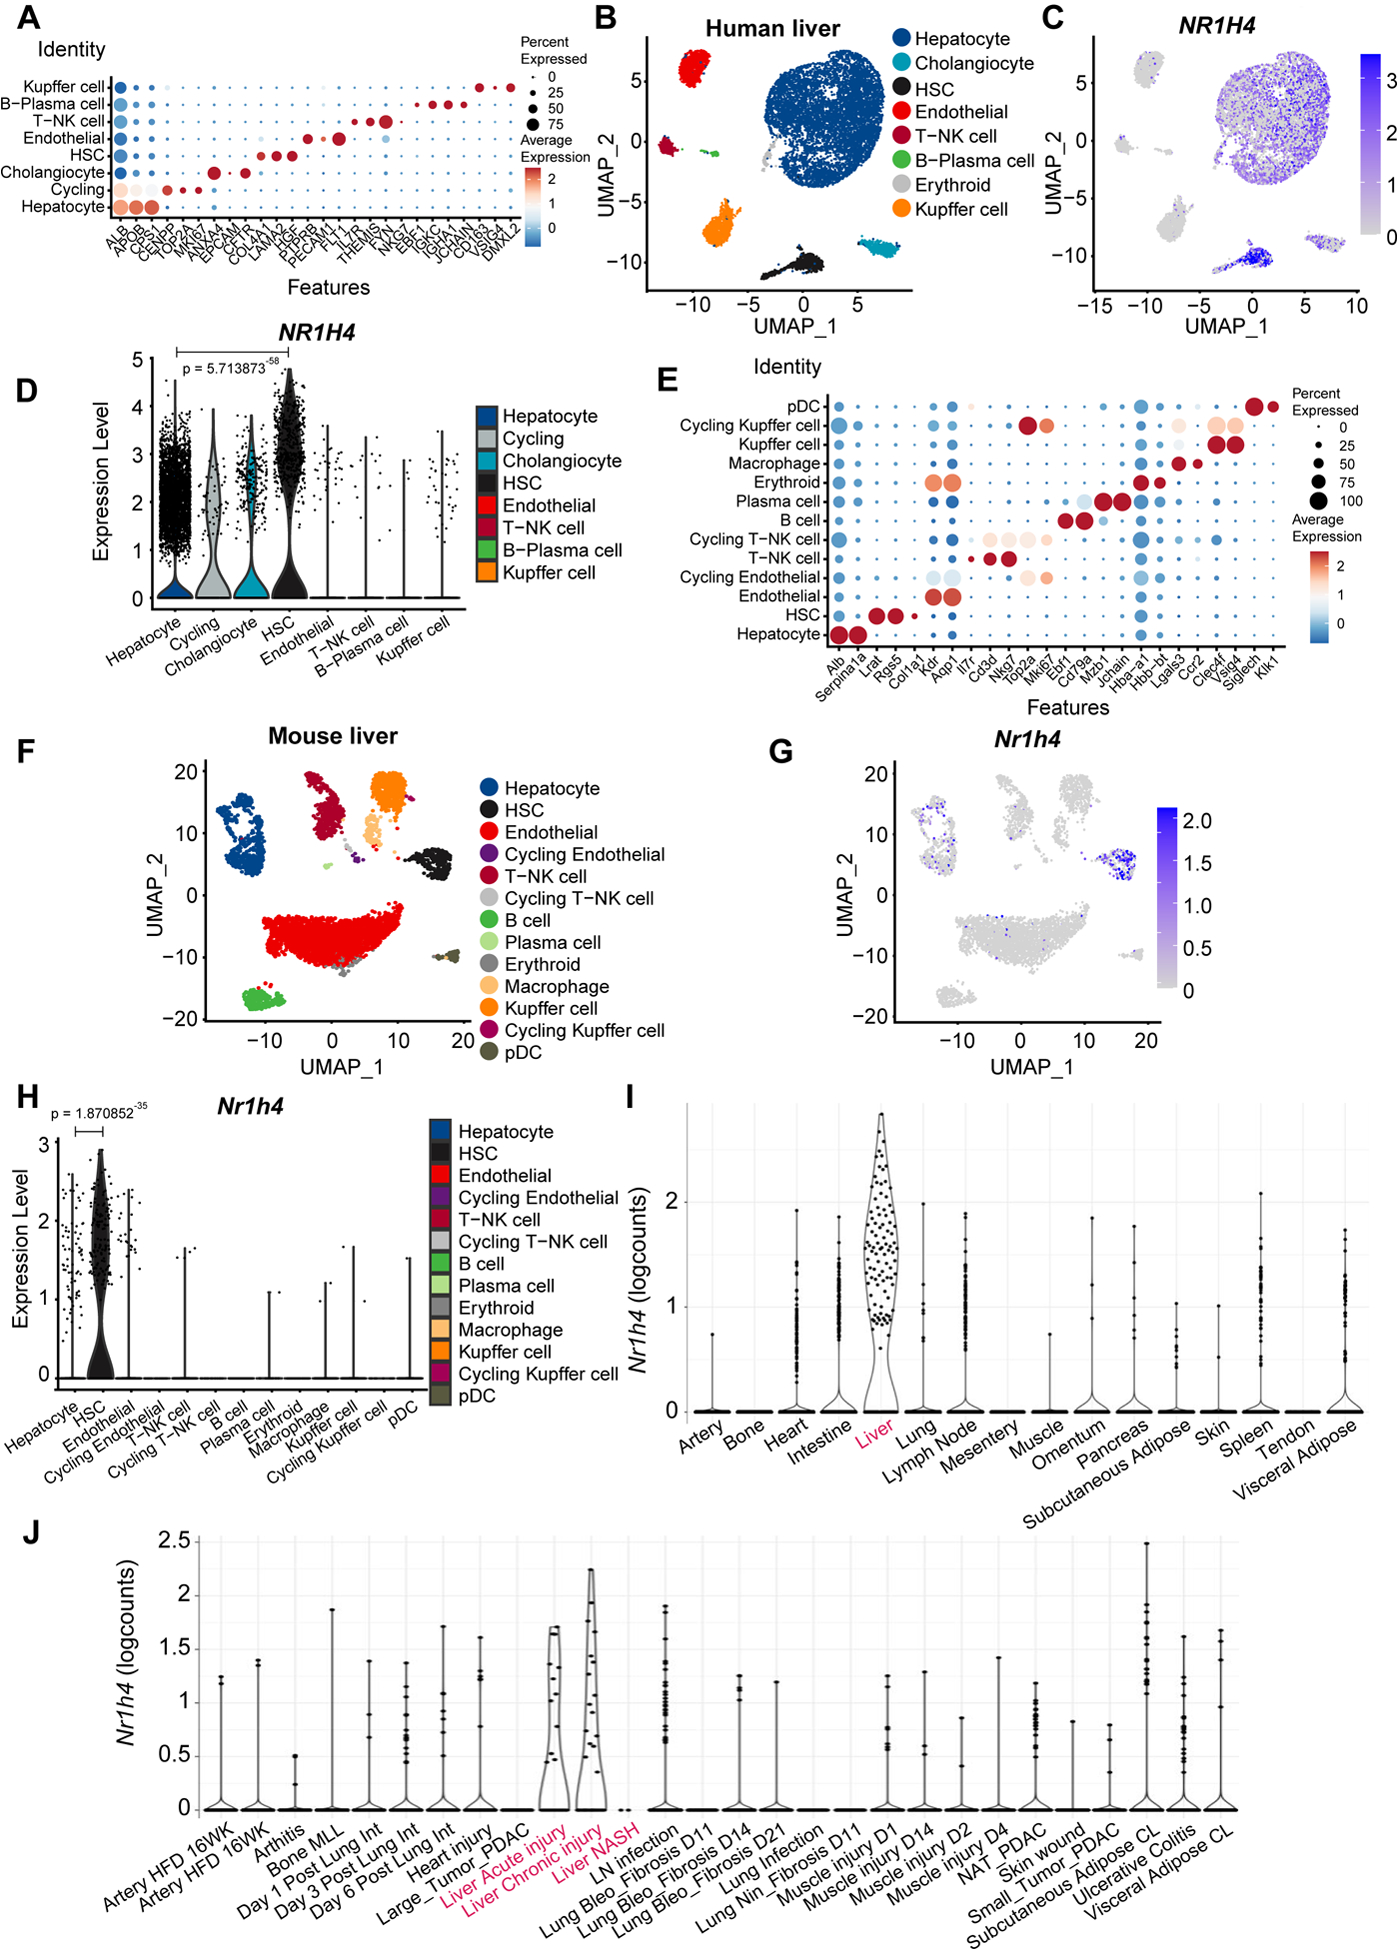
Fig. 3. FXR predominantly labels human and mouse HSCs.

(A) Annotation of cell types and selected marker genes obtained from single nuclei RNA sequencing (snRNA-seq) performed in human livers. Dot size indicates fraction of cells and colour indicates expression level (log-normalized and scaled). (B) Major clusters and respective cell-type assignments in UMAP from the experiment described in (A). (C) RNA expression of NR1H4 in the same embedding as (B). (D) Violin plot representing gene expression levels of NR1H4 from the experiment described in (A). (E) Annotation of cell types and selected marker genes obtained from single cell RNA sequencing (scRNA-seq) performed in liver tissue from healthy mouse. Dot size indicates fraction of cells and colour indicates expression level (log-normalized and scaled). (F) Major clusters and respective cell-type assignments in UMAP from the experiment described in (E). (G) RNA expression of Nr1h4 in the same embedding as (F). (H) Violin plot representing gene expression levels of Nr1h4 from the experiment described in (E). (I) RNA expression of Nr1h4 in fibroblasts from different tissues in steady-state mice. (J) RNA expression of Nr1h4 in fibroblasts from disease mouse models. Statistical analysis was performed using the Wilcoxon rank sum test with continuity correction.
