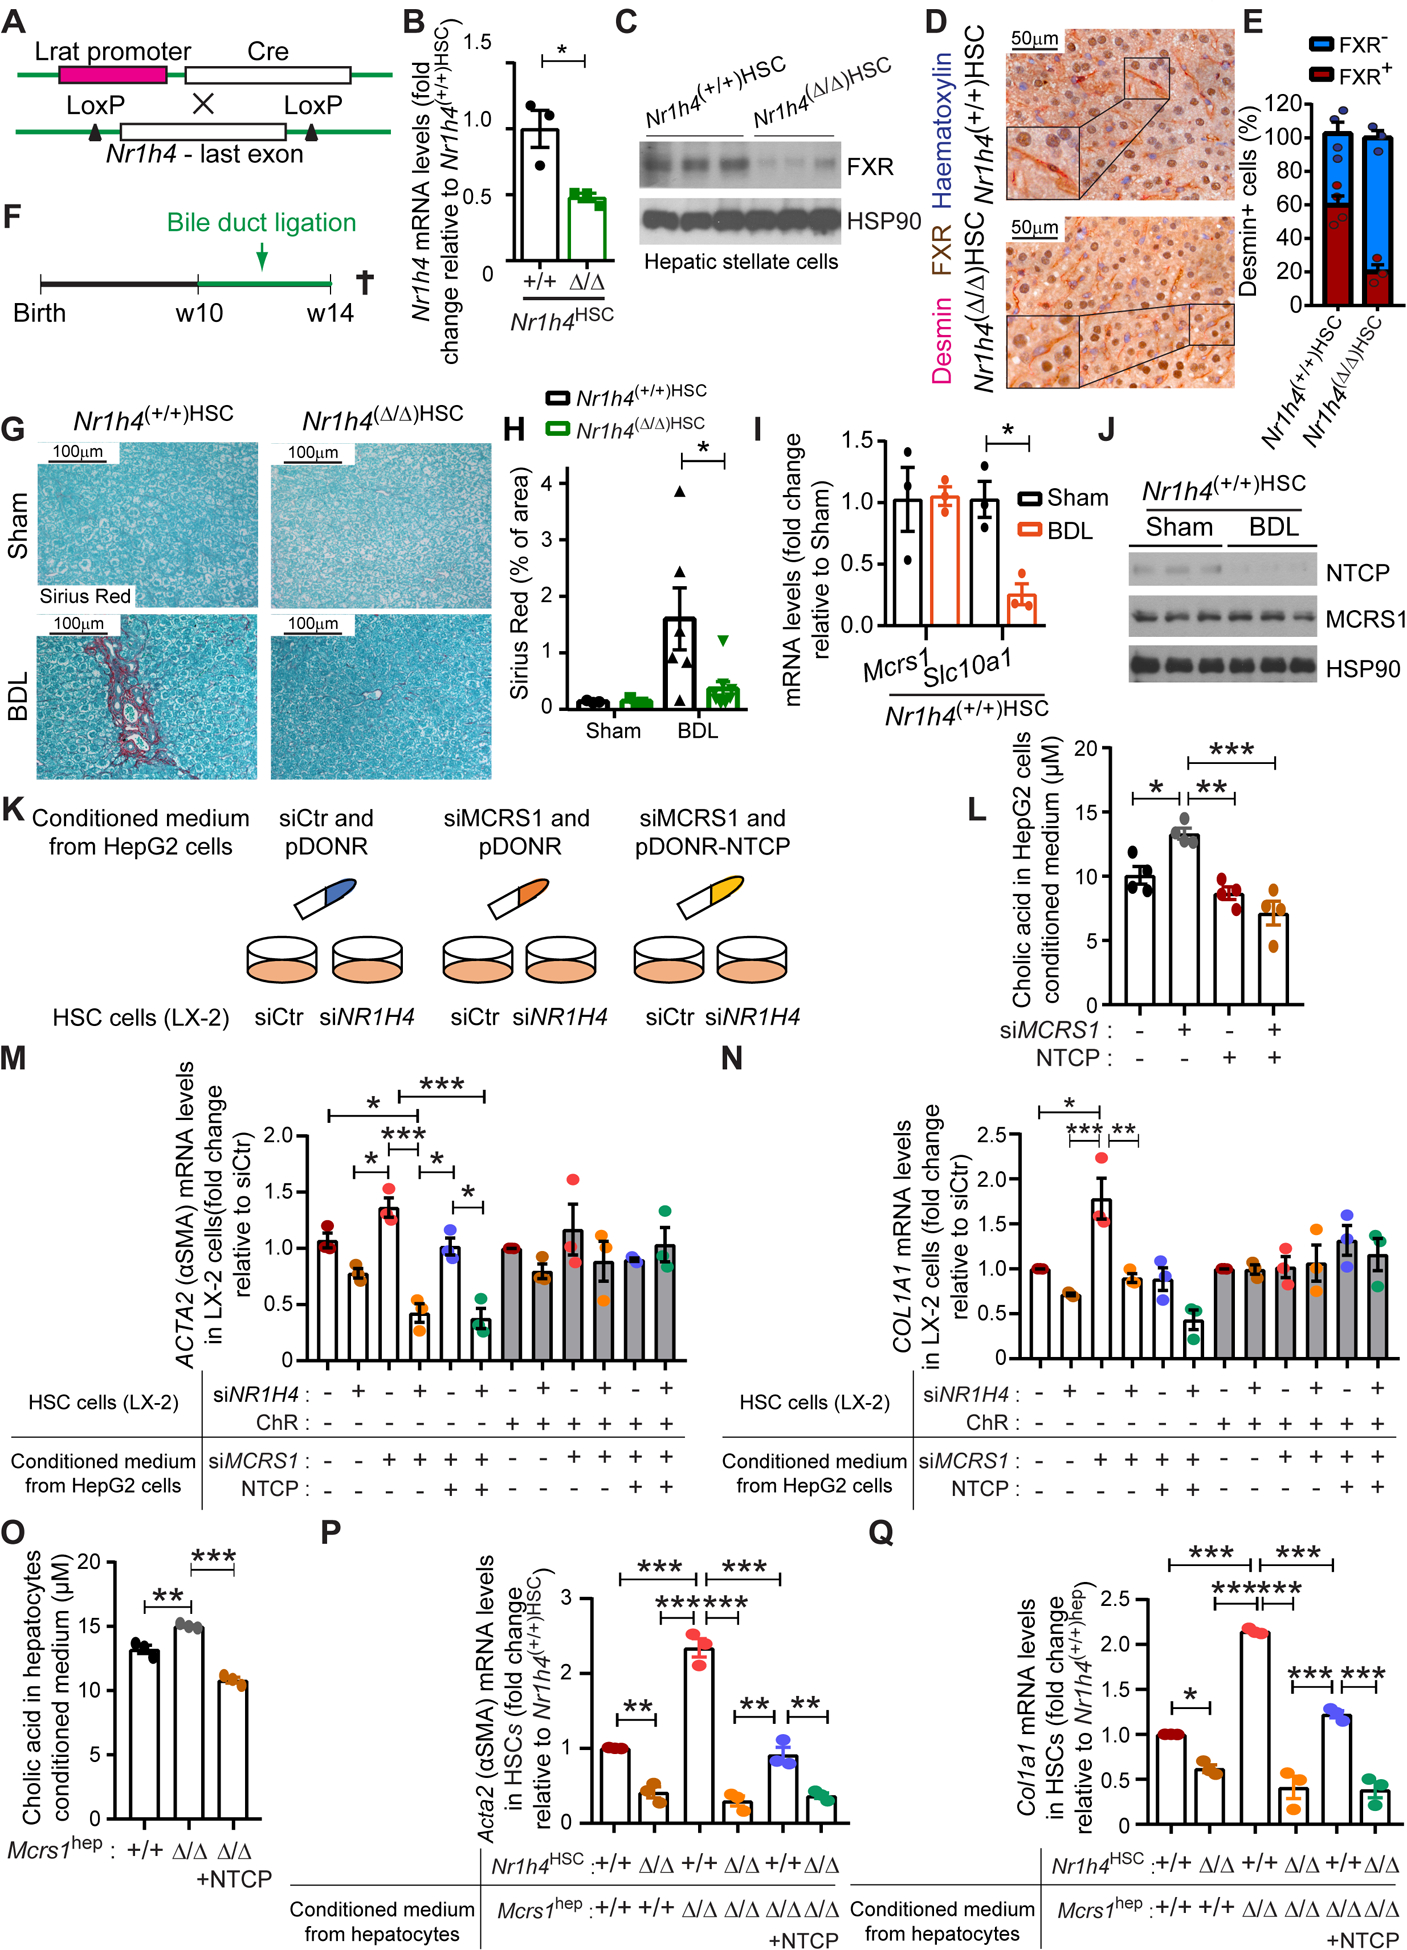
Fig. 4. BAs activate FXR in HSCs to promote liver fibrosis.

(A) Schematic representation of the Nr1h4HSC mouse model. (B) Relative mRNA levels of Nr1h4 of isolated HSCs from 14-week-old Nr1h4(+/+)HSC and Nr1h4(Δ/Δ)HSC mice (n=3). (C) WB of isolated HSCs from 14-week-old Nr1h4(+/+)HSC and Nr1h4(Δ/Δ)HSC mice. (D) Representative pictures of desmin/FXR co-IHC of livers from 14-week-old Nr1h4(+/+)HSC and Nr1h4(Δ/Δ)HSC mice. (E) Quantification of desmin/FXR co-IHC described in (D) (n=4,3). (F) Schematic representation of the bile duct ligation surgery protocol. (G) Representative pictures of Sirius Red staining of livers from 14-week-old Nr1h4(+/+)HSC and Nr1h4(Δ/Δ)HSC mice sham and bile duct-ligated (BDL). (H) Quantification of Sirius Red staining described in (G) (n=3,3,6,8). (I) Relative mRNA levels of indicated genes of isolated hepatocytes from Nr1h4(+/+)HSC mice sham and BDL (n=3). (J) WB of isolated hepatocytes from Nr1h4(+/+)HSC mice sham and BDL. (K) Schematic representation of the in vitro experiment performed in HepG2 and LX-2 cell lines. (L) Cholic acid levels measured in media from HepG2 cells transfected with siCtr or siMCRS1 and/or NTCP overexpression plasmid as indicated (N=4). (M) Relative mRNA levels of ACTA2 in LX-2 cells transfected with siCtr or siNR1H4 and treated with/without ChR, supplemented with conditioned medium from HepG2 cells transfected with siCtr or siMCRS1 and pDONR-Ctr or pDONR-NTCP as indicated (N=3). (N) Relative mRNA levels of COL1A1 in LX-2 cells transfected with siCtr or siNR1H4 and treated with/without ChR, supplemented with conditioned medium from HepG2 cells transfected with siCtr or siMCRS1 and pDONR-Ctr or pDONR-NTCP as indicated (N=3). (O) Cholic acid levels measured in media from isolated hepatocytes from Mcrs1hep mice and Mcrs1(Δ/Δ)hep mice overexpressing NTCP (N=3). (P) Relative mRNA levels of Acta2 in isolated HSCs from Nr1h4HSC mice supplemented with conditioned medium from isolated hepatocytes from Mcrs1hep mice and Mcrs1(Δ/Δ)hep mice overexpressing NTCP (N=3). (Q) Relative mRNA levels of Col1a1 in isolated HSCs from Nr1h4HSC mice supplemented with conditioned medium from isolated hepatocytes from Mcrs1hep mice and Mcrs1(Δ/Δ)hep mice overexpressing NTCP (N=3). Scale bar: 50 μm in (D) and 100 μm in (G). Statistical analysis was performed using unpaired two-tailed Student’s t test in (B) and (I), and two-way ANOVA with Tukey’s multiple comparisons test in (H), and (L) to (Q). Data are represented as means±SEM. *, p≤0.05; **, p≤0.01; ***, p≤0.001.
