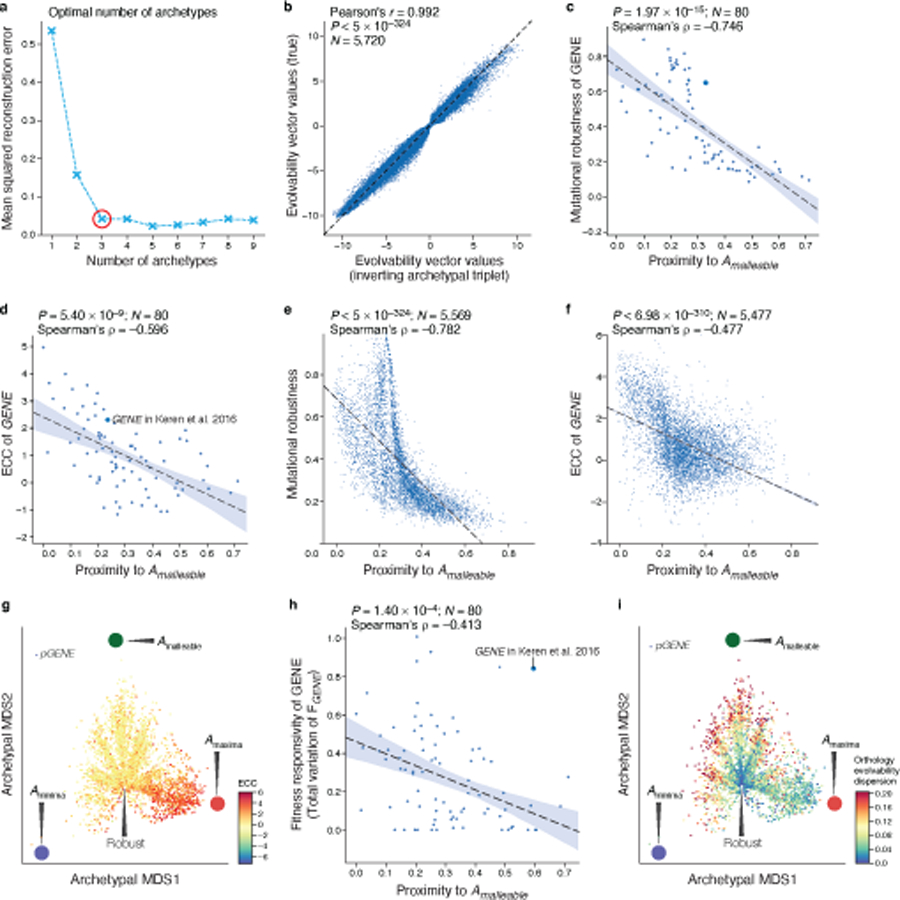
Extended Data Fig. 6 |. Analysis of regulatory evolvability reveals sequence-encoded signatures of expression conservation from solitary sequences.

a, Selection of optimal number of archetypes. Mean-square-reconstruction error (y axis) for reconstructing the evolvability vectors from the embeddings learned by the autoencoder for an increasing number of archetypes (x axis). Red circle: optimal number of archetypes selected as prescribed45 by the “elbow method”. b, The archetypal embeddings learned by the autoencoder accurately capture evolvability vectors. Original (y axis) and reconstructed (x axis) expression changes (the values in the evolvability vectors) for each native sequence (none seen by the autoencoder in training). Top left: Pearson’s r and associated two-tailed p-values. c-f, Evolvability space captures regulatory sequences’ evolutionary properties. Proximity to the malleable archetype (Amalleable) (x axis) and mutational robustness (c,e y axis) or ECC (d,f y axis) for all yeast genes (e,f) or the gene for which fitness responsivity was quantified (c,d). Top right: Spearman’s ρ and associated two-sided p-value. “L”-shape of relationship in e results from the robust cleft, Amaxima, and Aminima all being distal to Amalleable (left side of plot). g, All native (S288C reference) promoter sequences (points) projected onto the archetypal evolvability space learned from random sequences; colored by their ECC. Large colored circles: evolvability archetypes. h, The proximity to the malleable archetype (x axis) and fitness responsivity (y axis) for the 80 genes with measured fitness responsivity. Top right: Spearman’s ρ and associated two-tailed p-values. Light blue error band: 95% confidence interval. i, All native (S288C reference) promoter sequences (points) projected on the evolvability space learned from random sequences; colored by their mean pairwise distance in the archetypal evolvability space between all promoter alleles across the 1,011 yeast isolates for that gene (ortholog evolvability dispersion). Large colored circles: evolvability archetypes.
