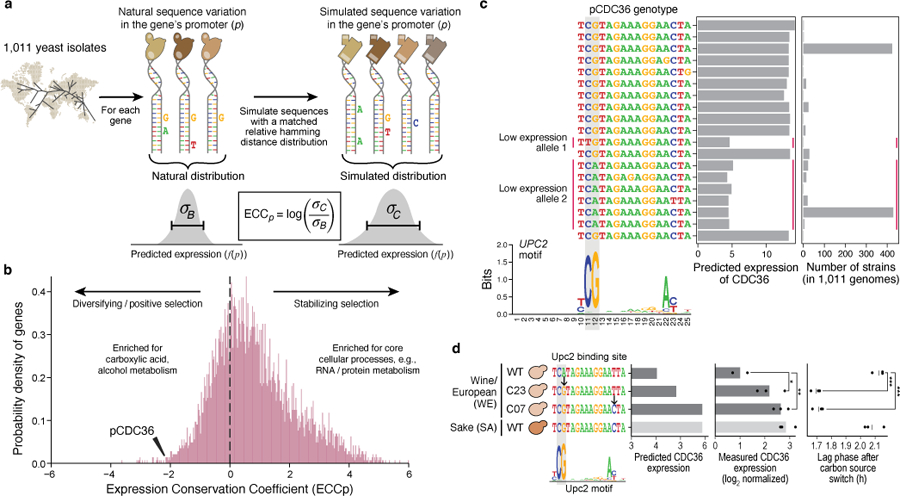
Fig. 3 |. The Expression Conservation Coefficient (ECC) detects signatures of stabilizing selection on gene expression using natural genetic variation in regulatory DNA.

a, ECC calculation from 1,011 S. cerevisiae genomes37. b, ECC distribution for S. cerevisiae genes. Frequency distribution of ECC values (x axis). Dashed line separates regions corresponding to disruptive/positive selection (left) and stabilizing selection (right). GO terms enriched by the ECC ranking are shown. Arrowhead: ECC value for the CDC36 promoter sequence. c, Convergent regulatory evolution in the CDC36 promoter. Predicted expression (x axis, left bar plot) and associated number of strains (x axis, right bar plot) of all alleles among the analyzed CDC36 promoter sequence within 1,011 yeast isolates, along with an alignment of their Upc2p binding site sequences (left; Upc2p binding motif below). Red vertical lines: two independently evolved low-expressing alleles. Grey vertical boxes: key positions in the Upc2p motif with single nucleotide polymorphisms. d, Validation of CDC36 promoter allele expression and organismal phenotype. Strains (y axis) with different Upc2p binding site alleles for both model-predicted CDC36 expression (left; predicted on −170:−90 region to capture entire Upc2p binding site), measured CDC36 expression (middle), and lag phase duration (right). Points: biological replicates (n=3); bars/vertical lines: means. Bar color: strain background. Student’s t-test p-values, unpaired, equal variance, one-sided (expression, WE WT vs. C23 p=0.044, C07 p=6.69*10−3) or two-sided (lag phase, WE WT vs. C23 p=1.34*10−4, C07 p=2*10−4); *p<0.05; **p<0.01; ***p<0.001.
