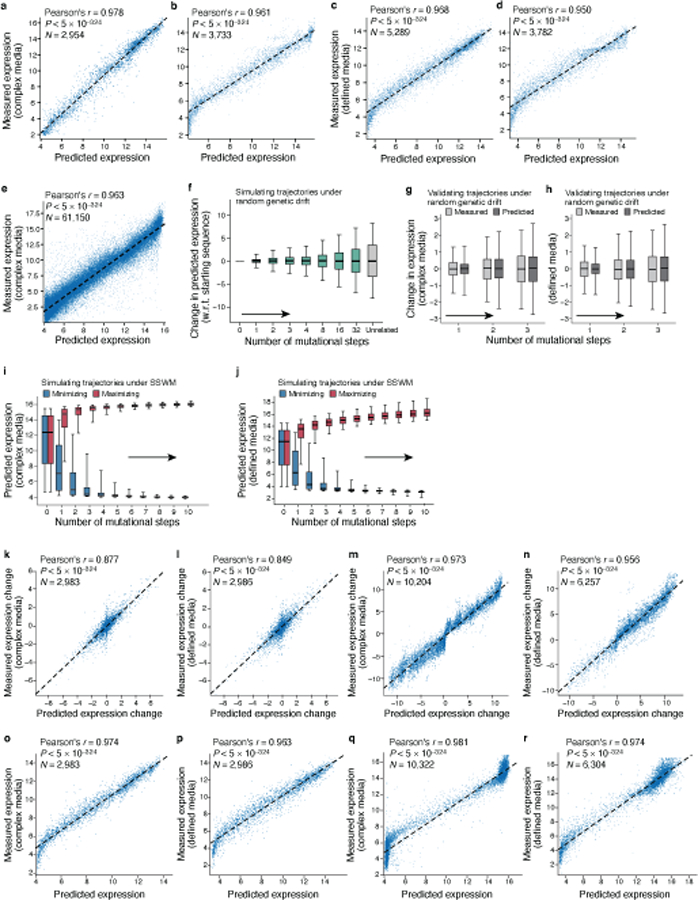
Extended Data Fig. 3 |. The transformer sequence-to-expression model generalizes reliably and helps characterize sequence trajectories under different evolutionary regimes.

a-d, Prediction of expression from sequence in the complex (a-b) and defined (c-d) media. Predicted (x axis) and experimentally measured (y axis) expression for (a,c) random test sequences (sampled separately from and not overlapping with the training data) and (b,d) native yeast promoter sequences containing random single base mutations. Top left: Pearson’s r and associated two-tailed p-value. Compression of predictions in the lower left results from binning differences during cell sorting in different experiments (Supplementary Notes). e, Predicted (x axis) and experimentally measured (y axis) expression in complex media (YPD) for all native yeast promoter sequences. Pearson’s r and associated two-tailed p-values are shown. f, Predicted expression divergence under random genetic drift. Distribution of the change in predicted expression (y axis) for random starting sequences (n=5,720) at each mutational step (x axis) for trajectories simulated under random genetic drift. Silver bar: differences in expression between unrelated sequences. g,h, Comparison of the distribution of measured (light grey) and transformer model predicted (dark gray) changes in expression (y axis) in complex media (g, n=2,983) and defined media (h, n=2,986) for synthesized randomly-designed sequences at each mutational step (x axis). i,j Predicted expression evolution under SSWM. Distribution of predicted expression levels (y axis) in complex media (i, n=10,322) and defined media (j, n=6,304) at each mutational step (x axis) for sequence trajectories under SSWM favoring high (red) or low (blue) expression, starting with 5,720 native promoter sequences. (f-j) Midline: median; boxes: interquartile range; whiskers: 5th and 95th percentile range. k-r, Comparison of model predicted expression for sequences synthesized previously for the random genetic drift and SSWM analyses. Experimentally measured (y axis) and transformer model predicted (x axis) expression level (o-r) or expression change from the starting sequence (k-n) in complex (k,m,o,q) or defined (l,n,p,r) media using sequences from the random genetic drift (Fig. 2c and (Extended Data Fig. 1e); k,l,o,p here) and SSWM (Fig. 2g and (Extended Data Fig. 1g); m,n,q,r here) validation experiments. Top left: Pearson’s r and associated two-tailed p-values.
