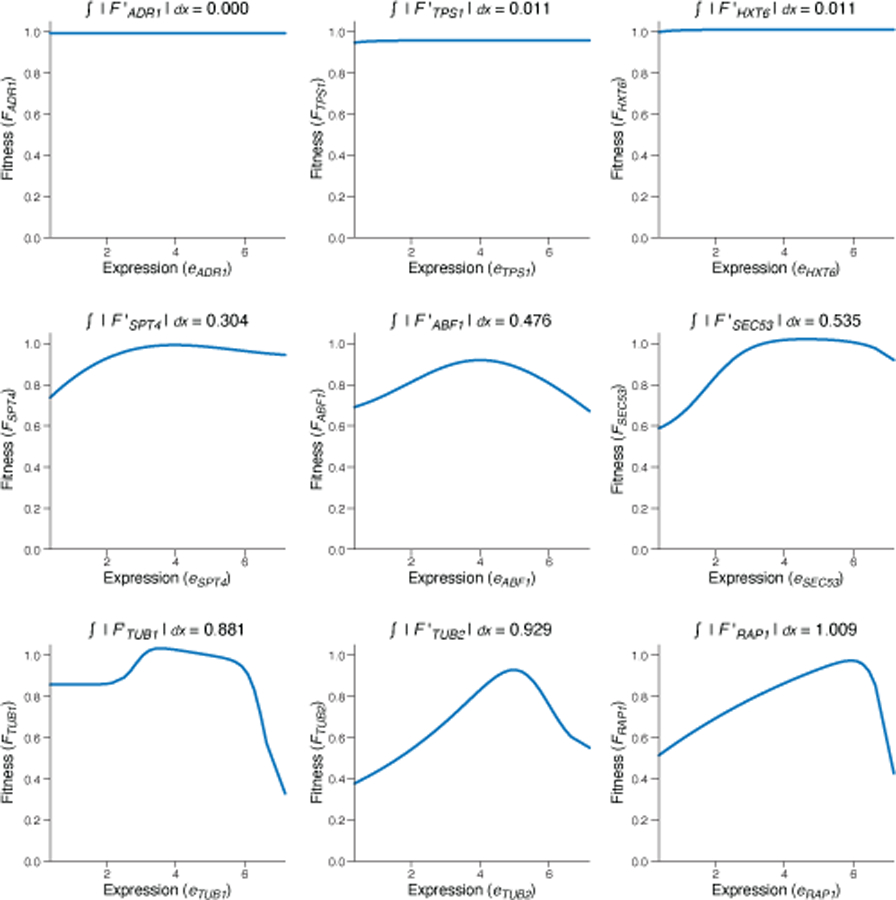
Extended Data Fig. 5 |. Fitness responsivity of a gene as the total variation of its expression-to-fitness relationship FGENE curves.

Expression (x axis) and fitness (y axis) levels for different promoter variants for each select gene fit from experimental measurements by Keren et al11. Fitness responsivity calculated as the total variation in each curve is noted above each panel.
