
Figure 2. Hepatocytes are the major cellular source of PAPSS2 in the liver, and creation and characterization of hepatocyte-specific Papss2 knockout mice.
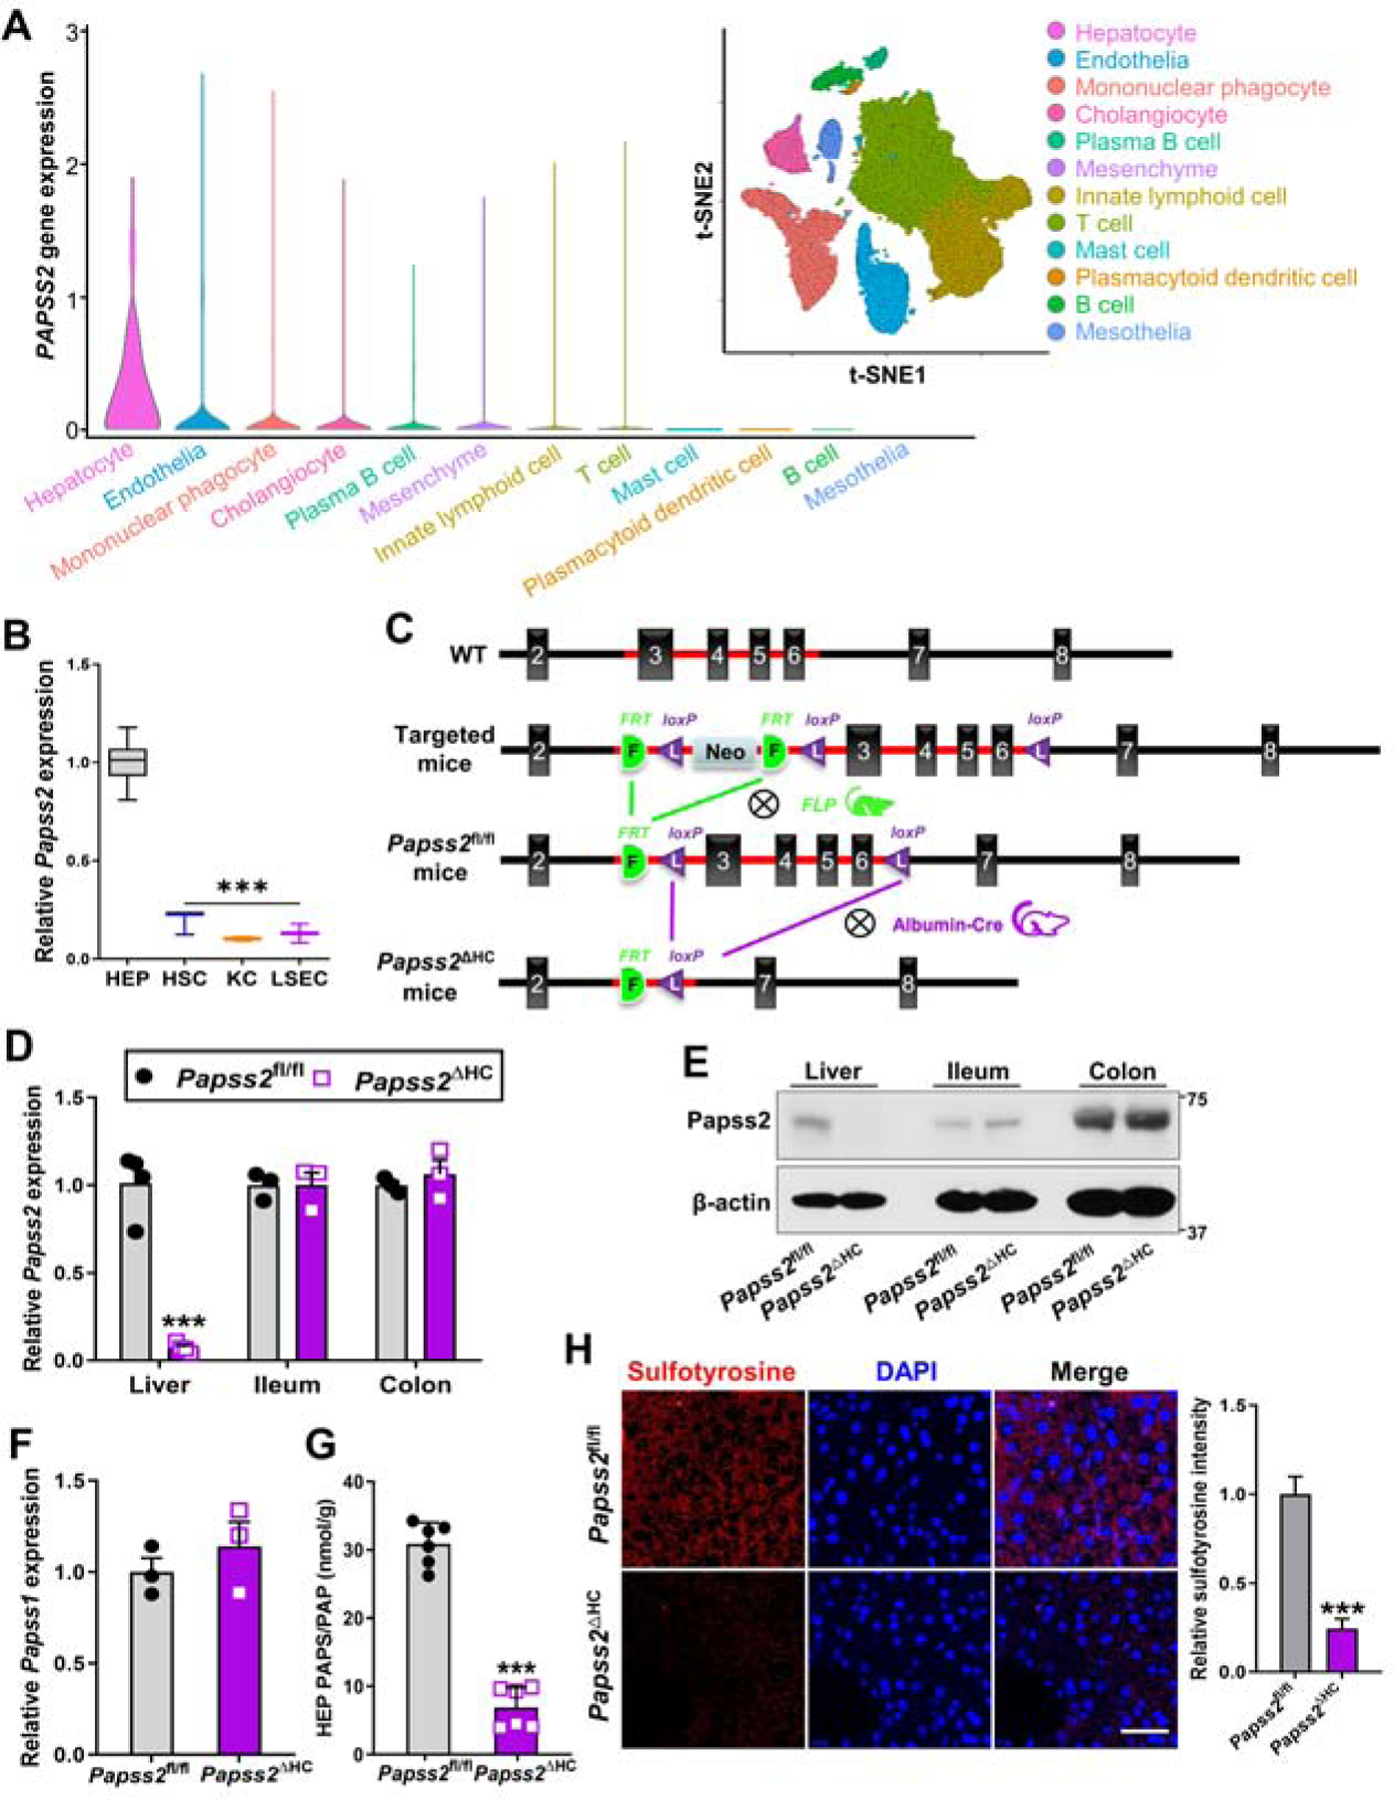
(A) Bioinformatic analyses of scRNA-seq dataset GSE136103 derived from normal human livers. Shown are scaled expression of PAPSS2 in different cell lineages and clustering of cell lineages. Shown on the upper right is cell lineages inferred from expression of marker gene signatures. t-SNE, t-distributed stochastic neighbor embedding. (B) Relative Papss2 mRNA expression in primary mouse hepatocytes (HEP), hepatic stellate cells (HSC), Kupffer cells (KC), and liver sinusoidal endothelial cells (LSEC). (n=7). (C) Strategies to create the Papss2fl/fl and Papss2ΔHC mice. (D to F) The mRNA (D) and protein (E) expression of Papss2 in the liver, ileum and colon, and mRNA expression of Papss1 in the liver (F) of Papss2fl/fl and Papss2ΔHC mice. (n=3–4). (G) Quantification of PAPS and PAP contents in primary hepatocytes. (n=6). (H) Immunofluorescent images of sulfotyrosine (red) in liver sections of intact Papss2fl/fl and Papss2ΔHC mice. Shown on the right are the quantifications of relative sulfotyrosine signals. Scale bar: 50 μm. ***P < .001. Data are presented as violin, box plots, or mean ± SEM.