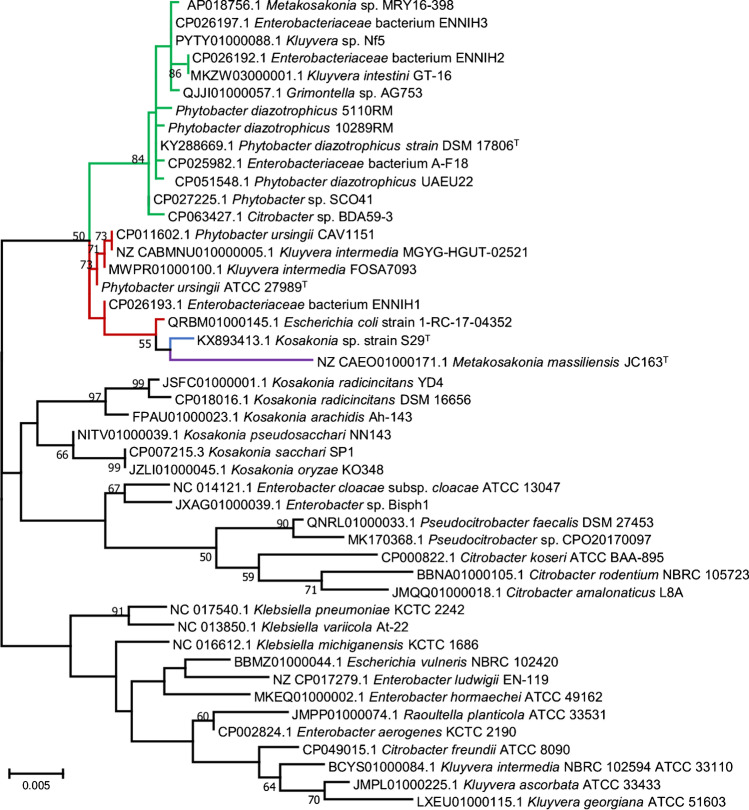
Fig. 2.
Phylogenetic tree showing the evolutionary relationship among Phytobacter species and other type species of the family Enterobacteriaceae based on 16S rRNA gene sequences (1457 bp). The tree was constructed by using the maximum likelihood method and the most optimal tree is shown. Line colours represent the different species: green: P. diazotrophicus, red: P. ursingii, blue: P. palmae, purple: P. massiliensis. Numbers at branching points are bootstrap percentage values (> 50%) based on 1000 replications. GenBank accession numbers are shown before the strain name. Bar, 0.005% nucleotide sequence difference

