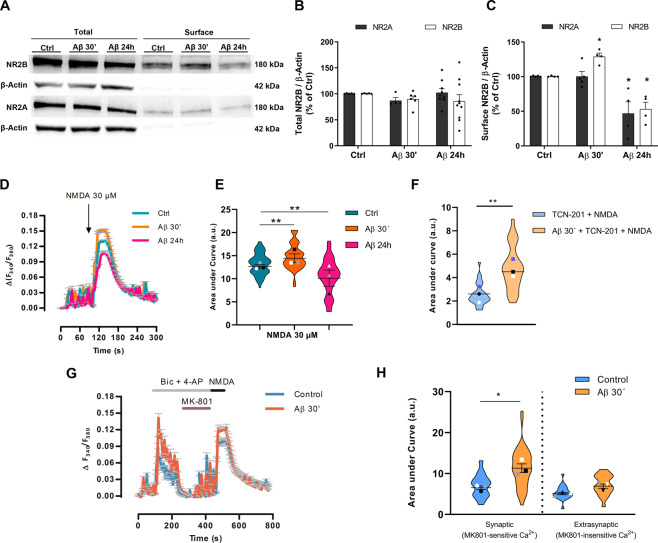
Fig. 3. Aβ promotes alterations of NR2A and NR2B subunit distribution and function in neurons.
A–C Cultured neurons were incubated with Αβ 1 µM for 30 min or 24 h, and total and biotinylated neuron-surface NR2A and NR2B were identified by western blot (A, supplemental material). Graph bars (means ± S.E.M.) represent the volume band intensities of total NMDAR subunits (B) and surface NMDA receptors (C) normalized to β-actin and expressed as a percentage of untreated cells. *p < 0.05, compared to non-treated (control) cells; paired two-way ANOVA. D, E Neurons were exposed to 1 µM Aβ for 30 minutes or 24 h, loaded with Fura-2AM for 30 minutes and Ca2+ rise was evaluated after application of 30 µM NMDA, 1 min. Each recording represent the average of 52–65 cells from 3 independent experiments. E Violin plot represents data distribution and mean ± S.E.M. of the area under curve for each condition in arbitrary units (a.u.). Data were analyzed with one-way ANOVA followed with Dunnet´s test; **p < 0.01; n = 3 cultures, 191 cells in total analysis. F Effects of 10 µM TCN-201, an NR2A antagonist, in NMDA-induced Ca2+ influx (1 min) in untreated and Aβ-treated neurons for 30 min. Violin plot shows data distribution and mean ± S.E.M. of area under curve of NMDA responses. Data were analyzed with two-tailed unpaired Student’s t-test; **p < 0.01. G Ca2+ recordings following synaptic and extrasynaptic NMDAR activation in control and neurons treated with 1 µM Aβ for 30 min (n = 3 experiments; 67 and 63 cells, respectively). Synaptic NMDAR activity was recorded after addition of 50 µM bicuculline and 2.5 mM 4-AP. Extrasynaptic NMDAR-mediated ion fluxes were recorded with NMDA agonist (30 µM) following synaptic NMDAR blockade with 10 µM MK-801 applied during treatment with bicuculline. H Violin plot represents data distribution and mean ± S.E.M. of area under Ca2+ response curve for control (untreated-cells) and Aβ-pretreated cells in synaptic and extrasynaptic-associated recorders. Data were analyzed with unpaired Student’s t-test; *p < 0.05.

