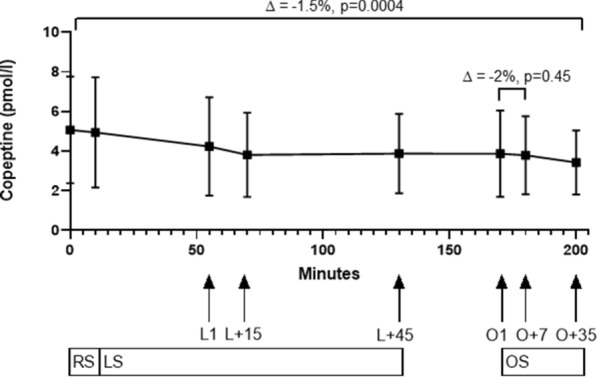
Figure 3.

Time plot of copeptin during all test sessions. RS resting session. ∆ = −0.9%, p = 0.14. LS learning session. ∆ = −22%, p = 0.0003. L1 time point when reaching target pain. L + 15 time point L1 plus 15 min. L + 45 time point L1 plus 45 min. OS opioid session. ∆ = −6%, p = 0.1. O1 time point of administration of opioids in addition to target pain. O + 7 7 min after O1. O + 35 35 min after O1. Arrows point to the corresponding time points. Boxes and whiskers represent mean and SD. Spearman rank correlation between copeptin levels and VAS scores at the trial endpoint time showed no correlation between VAS scores and copeptin levels (Spearman r − 0.26 (95% CI −0.65 to 0.25), p = 0.31).
