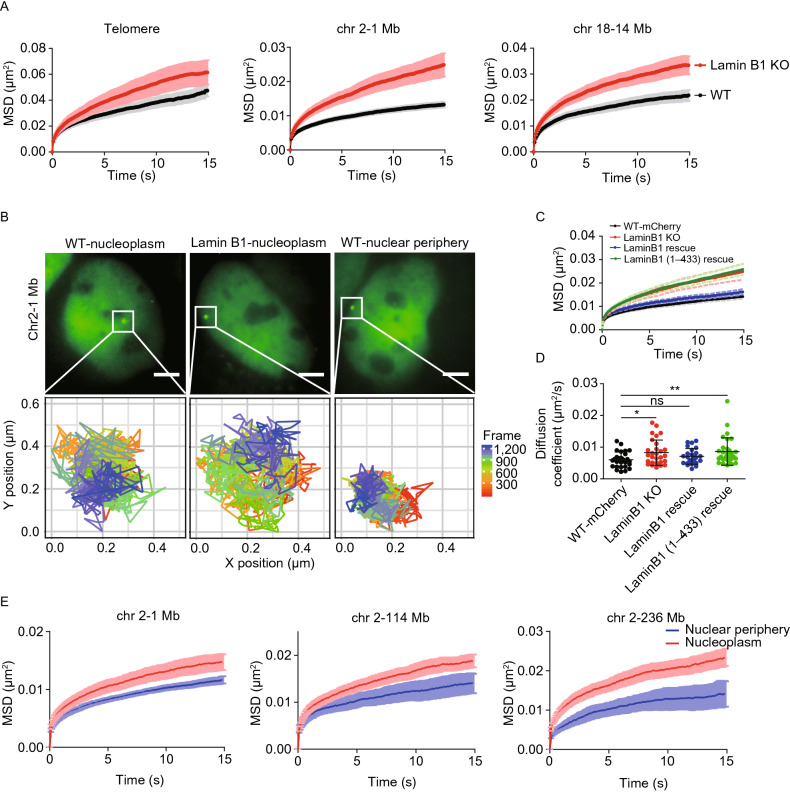
Figure 5.
Loss of chromatin-lamin B1 interaction increases chromatin mobility. (A) MSD curves of telomeres in WT (n = 100) and lamin B1-KO (n = 86) cells. MSD curves of 1Mb loci on chromosome 2 in WT (n = 27) and lamin B1-KO (n = 29) cells. MSD curves of 14 Mb loci on chromosome 18 in WT (n = 28) and lamin B1-KO (n = 33) cells. Mean ± standard error (SE). 3 independent experiments. (B) The tracking trajectories of labeled 1Mb loci on chromosome 2 in nucleoplasm of WT cells, nucleoplasm of lamin B1-KO cells and nuclear periphery of WT cells. Different colors of trajectories represent time lapse. Scale bars, 5 µm. (C) MSD curves of 1 Mb loci in WT (expressing mCherry, n = 29), lamin B1-KO (n = 29), lamin B1-rescue (n = 25) and lamin B1(1-433)-rescue (n = 30) cells. Mean ± SE. 3 independent experiments. (D) The diffusion coefficient of 1Mb loci in WT (expressing mCherry, n = 29), lamin B1-KO (n = 29), lamin B1-rescue (n = 25) and lamin B1(1-433)-rescue (n = 30) cells. Mean ± SD. *P < 0.05, *P < 0.01, unpaired t test. 3 independent experiments. (E) 3 genomic loci on chromosome 2 are tracked and assigned to nuclear periphery or nucleoplasm compartment, including 1 Mb loci (n = 27), 114 Mb loci (n = 30) and 236 Mb loci (n = 19). Averaged MSD curves of these loci in the two compartments are calculated and displayed as mean ± SE. 3 independent experiments

