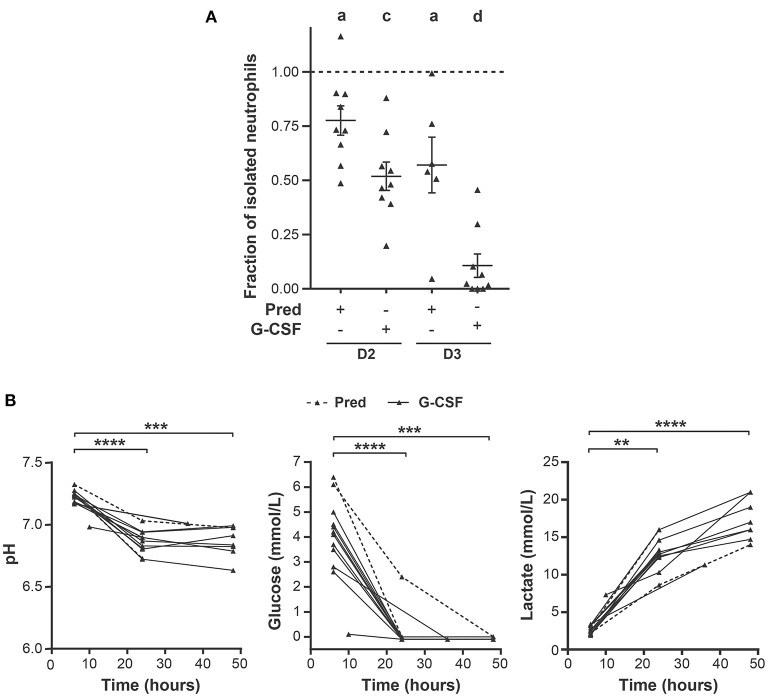
Figure 5.
Effect of storage on neutrophil isolation from GCs and GC metabolite composition. (A) Ratio of the number of neutrophils isolated with a density gradient 24 h (D2) or 48 h (D3) post-leukapheresis, and the number of neutrophils isolated from GCs right after leukapheresis (D1); (D2/D1 and D3/D1). Sample size: D1 (n = 9), D2 (n = 9), D3 (n = 7). Cell counting was performed with a hemacytometer after trypan blue staining. The dashed line corresponds to a ratio of 1. (B) The pH (left), glucose (middle) and lactate (right) concentrations were measured in GCs after the indicated times of storage. Prednisone, dashed line (n = 2), G-CSF solid line, (n = 10). Statistical analysis: A sample t test with a theorical mean of 1 was performed in (A), ap-value < 0.05; cp-value < 0.001 and dp-value < 0.0001. Sidak multiple comparison test was performed to compare GC metabolite content at 24 or 48 h of storage with that after 6 h of storage in (B), **p-value < 0.01; ***p-value < 0.001; ****p-value < 0.0001.

