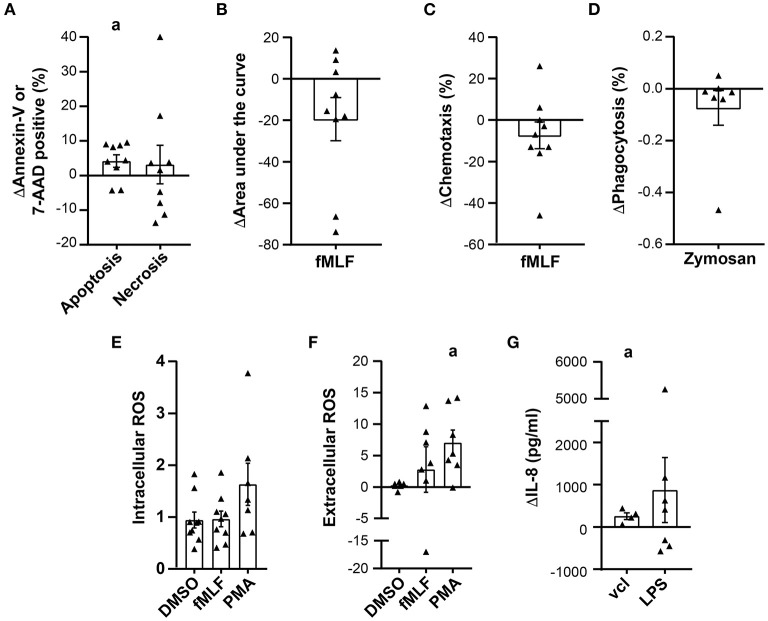
Figure 6.
Variation in prednisone GC neutrophil viability and function after 24 h of storage. Viability and functional assay data are presented as the difference between the values obtained on the day of leukapheresis (D1) and 24 h post-leukapheresis (D2), (D2-D1), in all graphs except in (E). (A) Difference in the proportion of apoptotic and necrotic neutrophils determined by Annexin-V and 7-AAD staining, respesctively (n = 9). (B) Difference in the fMLF-induced increase in intracellular calcium expressed as the area under the curve (n = 9). (C) Difference in the maximal proportion of neutrophils that migrated across a chemotaxis chamber toward fMLF (n = 9). (D) Effect of storage on the proportion of neutrophils that phagocytosed non-opsonized pHRodo Red Zymosan conjugated particles (n = 7). (E) Neutrophil fMLF and PMA-induced intracellular ROS production expressed as a ratio of the MFI (D1/D2); n = 9 and n = 7, respectively. (F) Change in fMLF and PMA-induced superoxide anion production expressed as the difference in O2− produced on D1 and D2 (n = 7). (G) Difference of IL-8 production expressed in pg/ml (n = 8). Statistical analysis: One sample t test with a hypothetical mean of 0 [in (A–D,F,G)] or 1 (in (E) was performed to determine the significance of the difference or ratio between values obtained on D1 and D2, ap-value < 0.05.

