FIGURE 4.
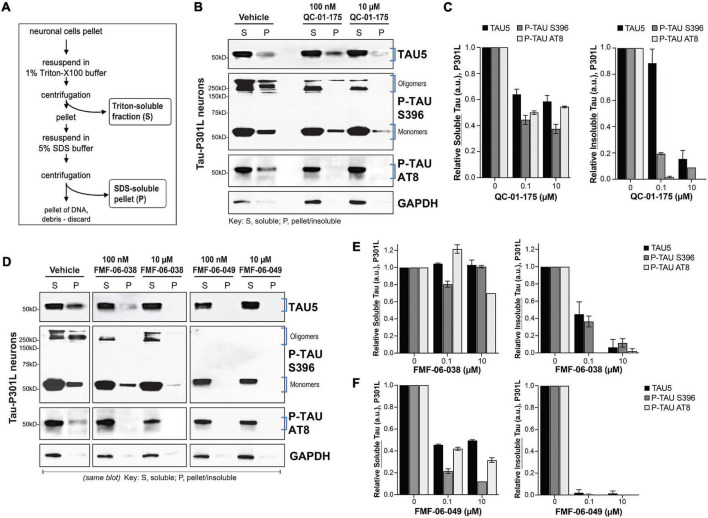
Lead tau degraders have a more pronounced effect on insoluble tau of FTD neurons. (A) Summary of the assay for protein fractionation, based on Triton-X (S, soluble) and SDS (P, pellet) detergents protein differential solubility. (B,C) Western blot and densitometry quantification of total tau (TAU5), P-tau S396 and P-tau S202/T205 (AT8) in the soluble (S) and insoluble-pellet (P) lysate fractions of P301L neurons (6-weeks differentiated) treated with QC-01-175 for 24 h at 100 nM or 10 μM. Brackets (B) indicate the bands corresponding to densitometry quantification in (C). Graph bars represent mean densitometry ± SEM for soluble (left) and insoluble (right) tau levels relative to vehicle samples. n = 3 biological replicates. (D–F) Western blot analysis and densitometry quantification of total tau, P-tau S396 and P-tau S202/T205 (AT8) in the soluble (S) and insoluble-pellet (P) lysate fractions of P301L neurons treated with FMF-06-038 and FMF-06-049 for 24 h at 100 nM or 10 μM. Samples were run on the same blot (D), and the image was cropped only for the purpose of this figure to exclude samples not included in the study. Brackets indicate protein bands in the densitometry analysis. (E,F) Graph bars represent mean densitometry ± SD for soluble (left) and insoluble (right) tau levels relative to vehicle samples. 0 μM data points correspond to vehicle alone (DMSO) control treatment. n = 2 biological replicates.

