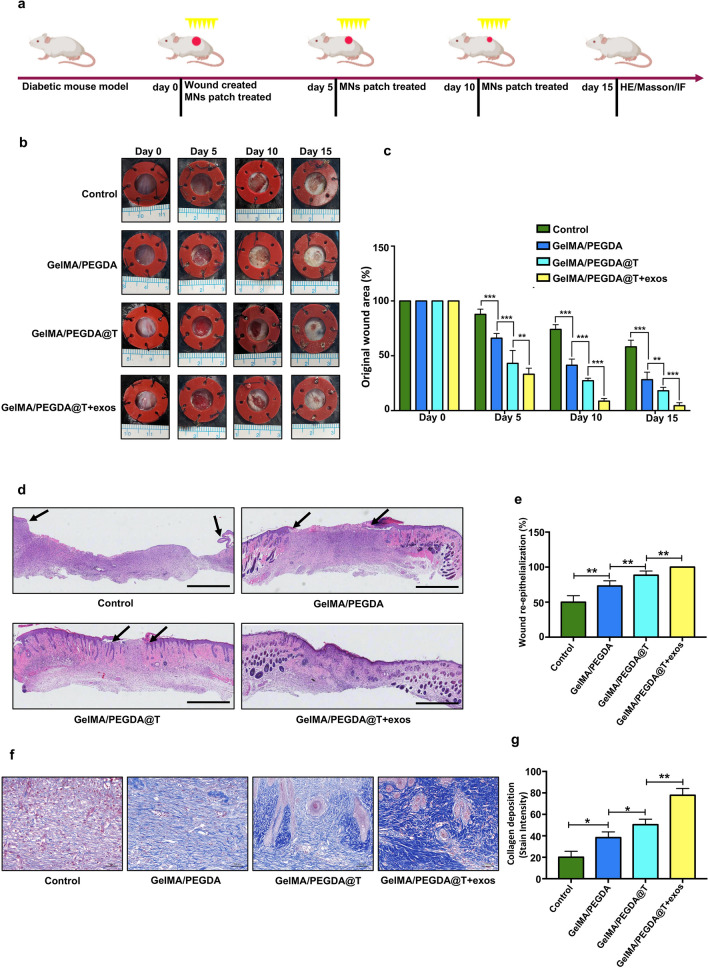
Fig. 8.
Effect of MNs patch on wound healing in a mouse model. a Schematic diagram of the diabetic wound model and treatment strategy. b Gross view of excisional wounds in mice treated with MNs patch at different time points. c Measurement of wound areas shown in b. d H&E staining analysis of wound sections following four different treatments at day 15 post-wounding. The single-headed arrows indicate the un-epithelialized areas. Scar bar = 1 mm. e Qualification of wound re-epithelialization shown in d. f Evaluation of collagen deposition by Masson staining at day 15 post-wounding. g Qualification of the stain intensity of blue collagen shown in f. Scar bar = 100 μm. *p < 0.05, **p < 0.01, ***p < 0.001, ****p < 0.0001

