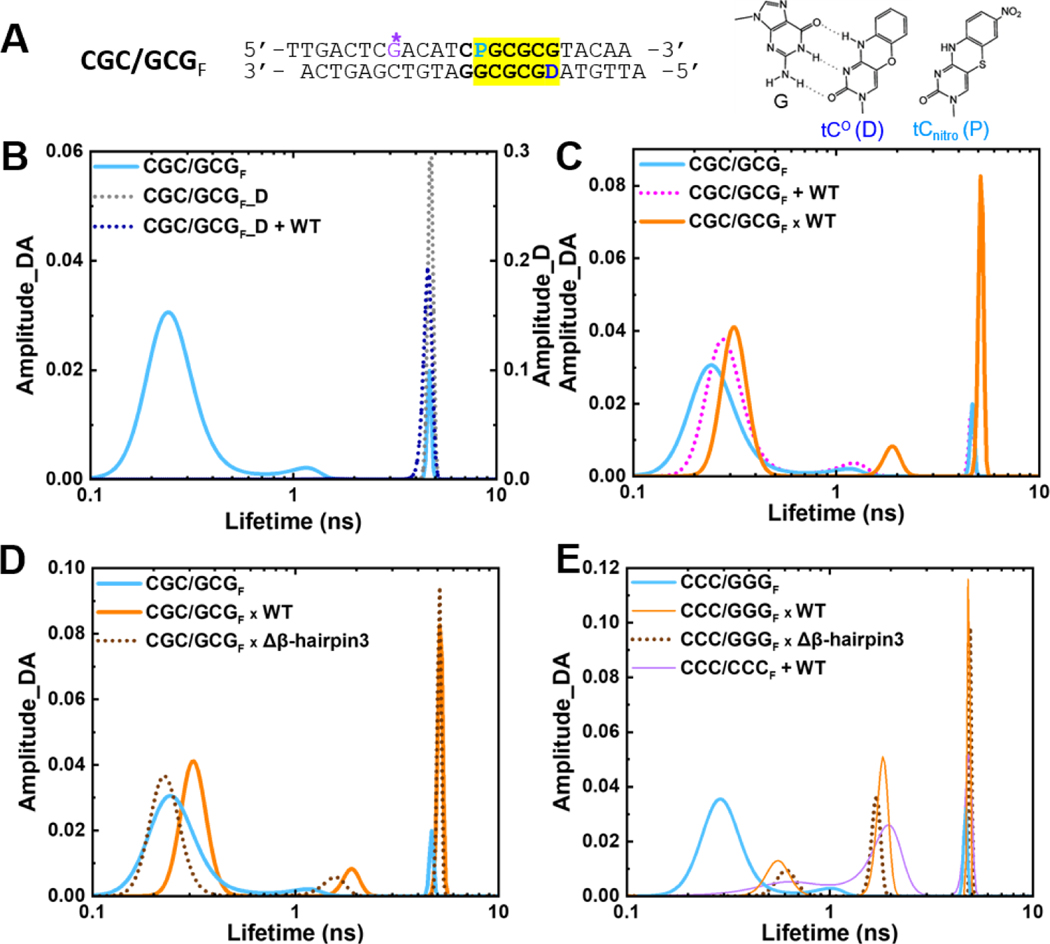
Fig. 3. Conformational distribution of DNA and DNA-protein complexes in solution revealed by fluorescence lifetime measurements.
(A) The donor/acceptor-labeled, CG/GC-repeat DNA construct used for FLT studies (“CGC/GCGF”). The segment containing CG/GC’s is highlighted in yellow. ‘D’ indicates Tc° (FRET donor) and ‘P’ is tCnitro (FRET acceptor). G* is disulfide-modified guanine for tethering. (right) Chemical structures of tC° and tCnitro. As cytosine analogs, they form Watson-Crick type base-pairing with guanine (G), as shown on the left for tC°. (B) FLT distributions of the donor/acceptorlabeled CGC/GCGF (cyan) and the donor-only DNA (CGC/GCGF_D) in the absence (dotted grey) and presence of WT Rad4 (dotted blue). (C) FLT distributions of CGC/GCGF when by itself (cyan), noncovalently bound to (“+”; dotted magenta) or site-specifically tethered with WT Rad4 (“x”; orange). (D) FLT distributions of CGC/GCGF when by itself (cyan), tethered to WT Rad4 (orange) or to Δβ-hairpin3 (dotted brown). (E) FLT distributions of CCC/GGGF when by itself (cyan), tethered to WT Rad4 (orange) or to Δβ-hairpin3 (dotted brown) as well as the mismatch DNA CCC/CCCF + WT (purple). Data in (E) are adopted from our previous study [28]. All amplitudes indicate the normalized, fractional amplitudes of the donor/acceptor (Amplitude_DA) or the donor-only construct (Amplitude_D). Reproducibility of FLT distributions for each sample is shown in Figure S6. DNA sequences containing fluorescent probes and full reports of the lifetimes, fractional amplitudes, FRET efficiencies of each peak as well as the sample’s average FRET efficiencies are in Table S3.

