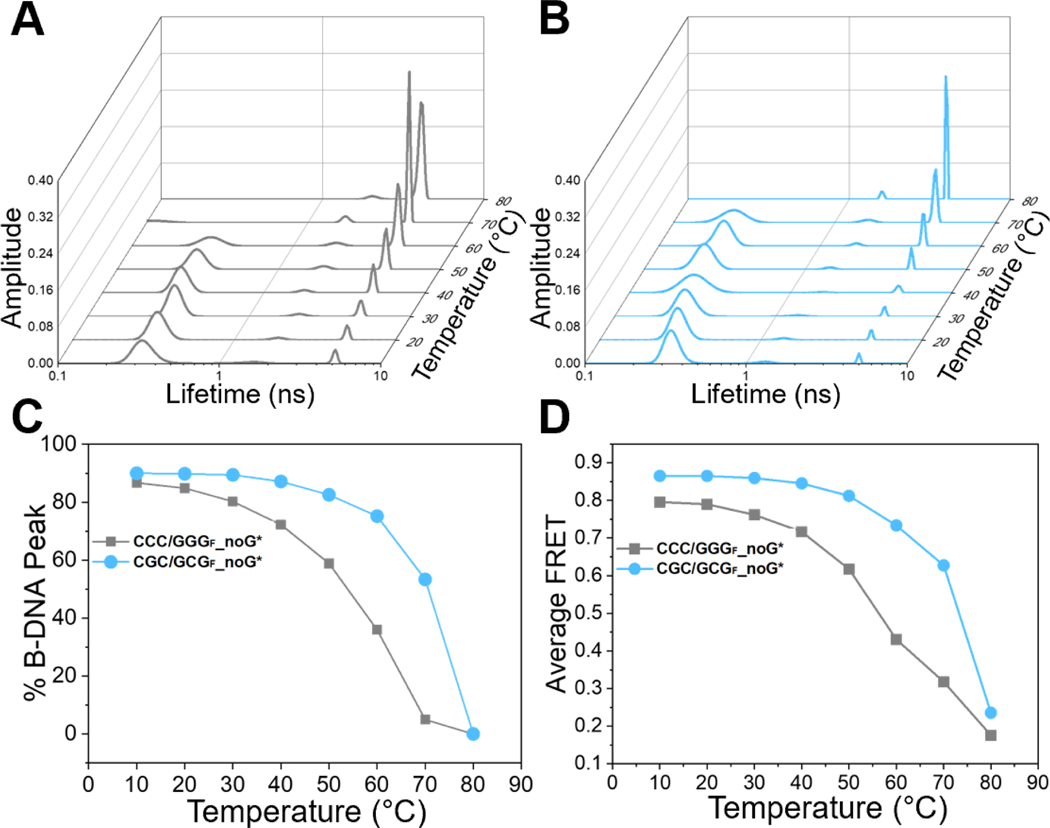
Fig.4. Temperature dependence of FLT distributions shows local pre-melting for CCC/GGG but not for CGC/GCG.
(A-B) FLT distributions with increasing temperatures (10 °C to 80 °C) for donor/acceptor-labeled DNA constructs containing either the CCC/GGG (grey, left) or CGC/GCG (cyan, right) sequence motifs. (C) Fractional population of B-DNA conformation (taken from τ1, the short lifetime component) versus temperature and (D) Average FRET versus temperature, plotted for each DNA. The average FRET was calculated as , where the donor-only lifetimes (τD) for the DNAs were taken as 4.8 ns. The uncertainties reported are standard deviations (s.d.) from 2 independent sets of measurements, and they were usually less than 5%. DNA sequences and plotted values are in Table S5.

