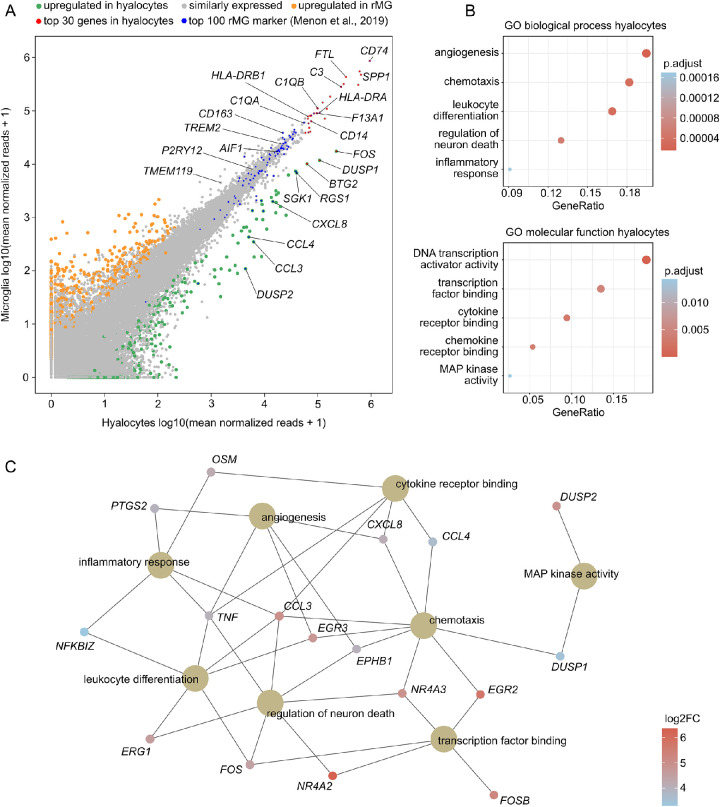
Figure 3.
Pairwise transcriptional comparison of hyalocytes and retinal microglia. (A) Readplot comparing mean expression of each gene between hyalocytes (x-axis) and retinal microglia (y-axis). Upregulated genes in hyalocytes are colored green, and upregulated genes in retinal microglia are shown in orange. The top 30 expressed genes in hyalocytes from Figure 1 are marked in red. In addition, the top 100 most specific retinal microglia marker from published single cell RNA-Seq data of the human retina are shown in blue. (C) Dotplots visualizing the top five Gene ontology (GO) biological processes and molecular functions, which the upregulated genes in hyalocytes were involved in. The adjusted P value of each GO term is shown by color. (D) The genes associated with the most significantly enriched GO terms from (C) are illustrated in the cnetplot, with the color representing the log2 fold change between hyalocytes and retinal microglia.

