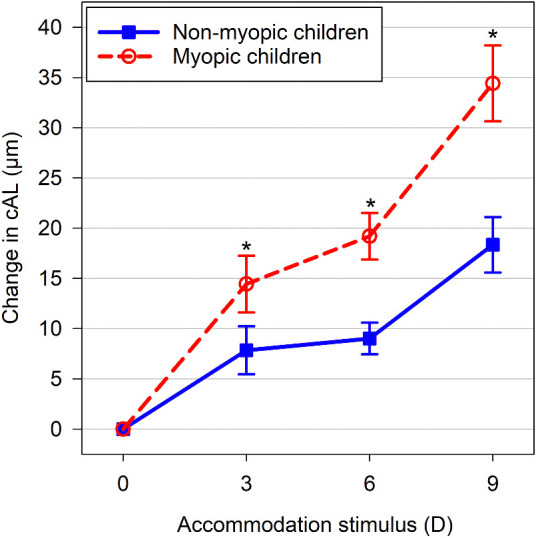
Figure 3.

Mean change in cAL during accommodation for the nonmyopic (solid line/filled squares) and myopic children (dashed line/open circles). The error bars represent the SEM. Asterisks indicate significant pairwise differences in the mean change between refractive error groups (all p ≤ 0.03).
