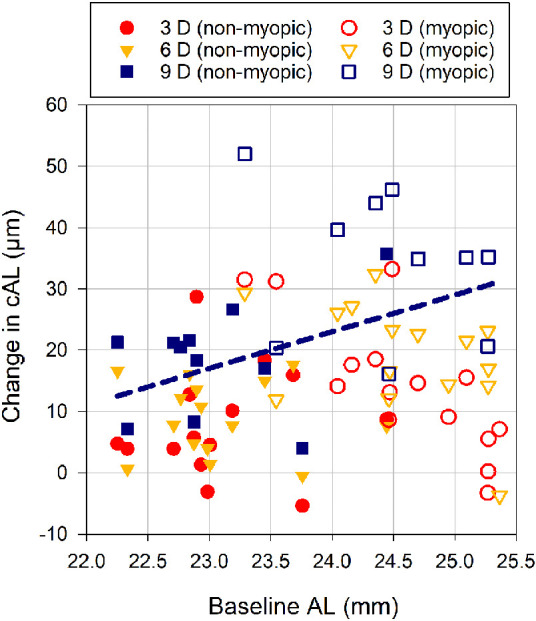
Figure 6.

Scatterplot showing the association between the change in cAL at the 3 (circles), 6 (triangles), and 9 D (squares) accommodation stimuli and baseline AL (i.e., for the 0 D stimulus) for the nonmyopic (filled symbols) and myopic children (open symbols). The dashed line represents the linear regression fit as calculated from the estimate of fixed effects in the LMM analyses for the 9 D stimulus (Regression equation: ΔcAL = −121 + 6 × AL, where cAL is in micrometers and AL is in millimeters), with the Pearson correlation coefficient of r = 0.46 (P = 0.04).
