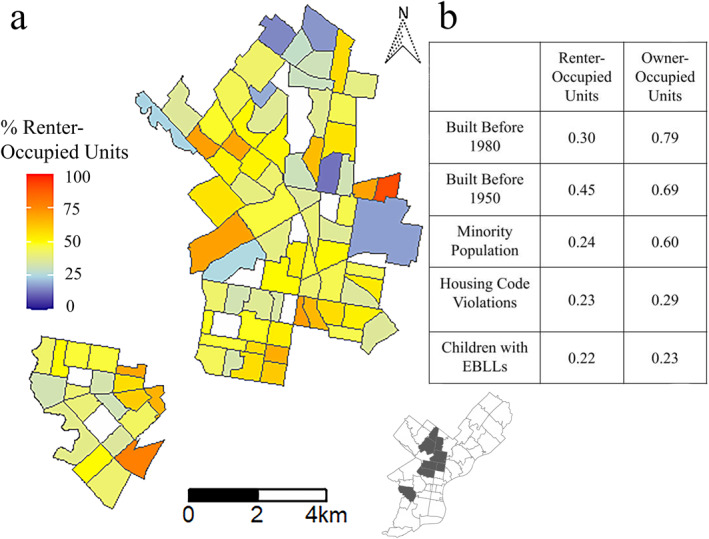
Figure 1.

(a) Map illustrating the percentage of renter‐occupied units across the census tracts analyzed; (b) Comparison of Spearman correlation coefficients for renter‐occupied and owner‐occupied units across various lead‐risk factors. The inset shows a map of Philadelphia with all the high‐risk zip codes, that is, the region of focus in this study, highlighted in gray. Because the inset outlines zip codes rather than census tracts, the map and the inset do not perfectly align.
