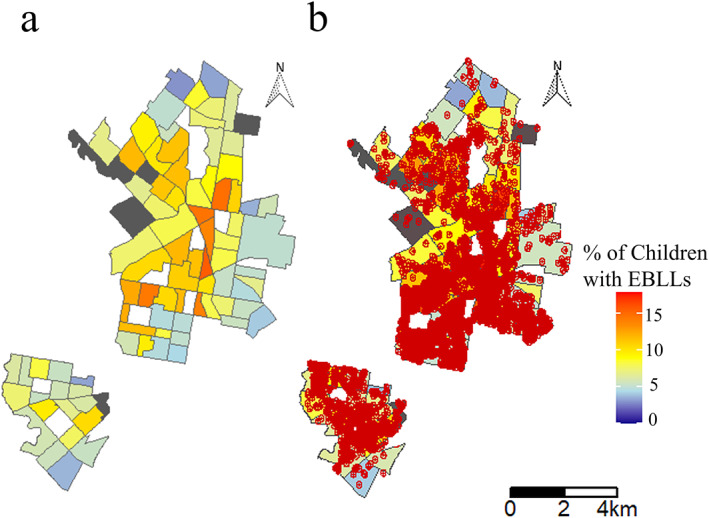
Figure 2.

(a) Map presenting the percent of children with EBLLs by census tract, as collected in 2015 by the City of Philadelphia; (b) Map displaying each housing unit demolished (red dot) from 2007 to 2020 and each demolished unit's 122‐m radius of impact (red circle) superimposed onto the EBLL map shown in (a). The EBLL legend applies to both maps.
