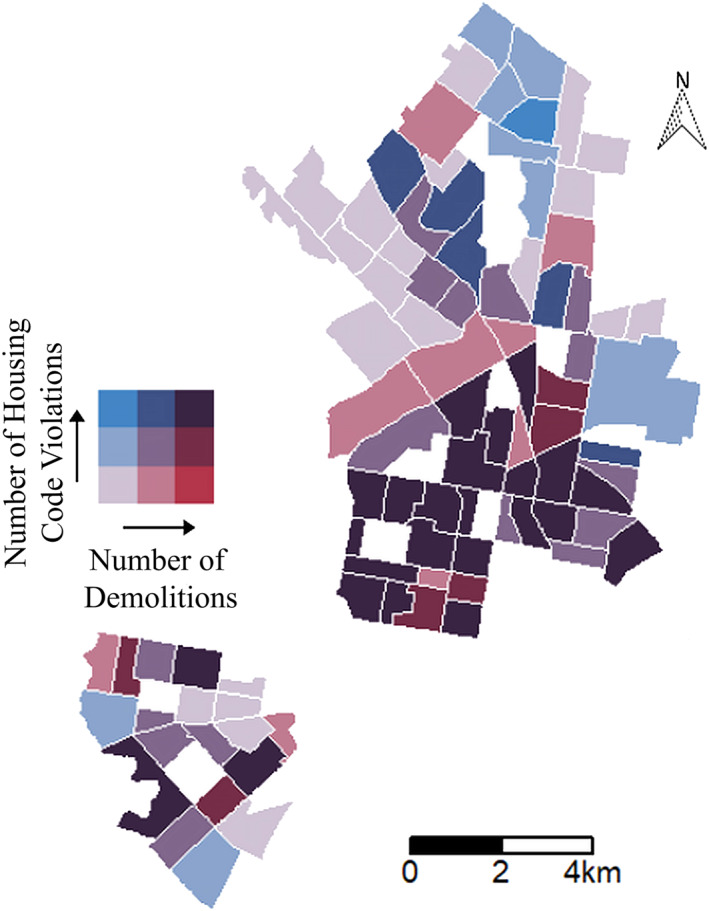
Figure 3.

A bivariate map that presents census tracts where demolitions and housing code violations are the most prevalent, illustrated by the deep purple color. Census tracts with a high number of demolitions are represented by increasingly darker pinks, whereas census tracts with a high number of housing code violations are represented by increasingly darker blues. Census tracts with few demolitions and housing code violations are represented by a light lavender.
