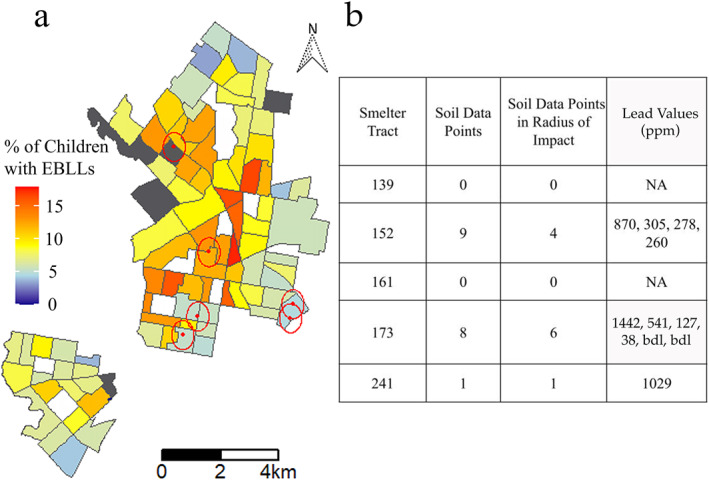
Figure 4.

(a) Map displaying the sites of the six historic smelters in the study area (red dots) and each site's 500‐m radius of impact (red circles); (b) soil data for each census tract that hosts a former smelter, along with sampling points specifically within the smelter's radius of impact. bdl = below detection limit.
