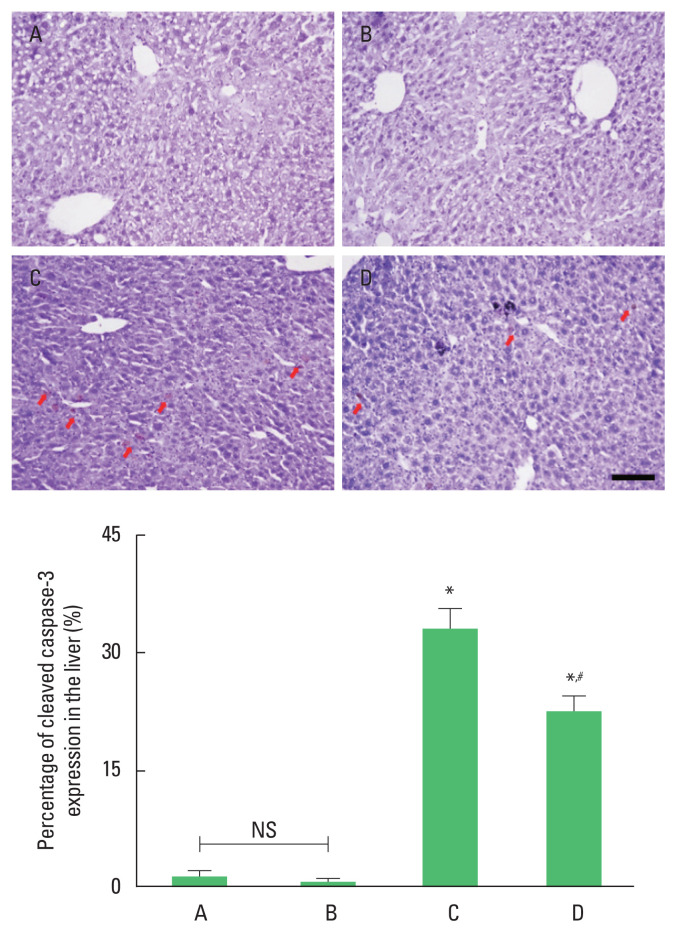
Fig. 3.
The percentage of cleaved caspase-3-positive cells in the liver. Upper panel: photomicrographs of cleaved caspase-3-positive cells. Red arrows indicate cleaved caspase-3-positive cells. Scale bar represents 100 μm. Lower panel: number of cleaved caspase-3-positive cells in each group. ns indicates nonsignificant. *P<0.05 compared to the control group. #P<0.05 compared to the exercise group. A, control group; B, exercise group; C, ethanol with lipopolysaccharide (LPS) and carbon tetrachloride (CCl4) application group; D, ethanol with LPS and CCl4 application and exercise group; NS, nonsignificant.

