Figure 1.
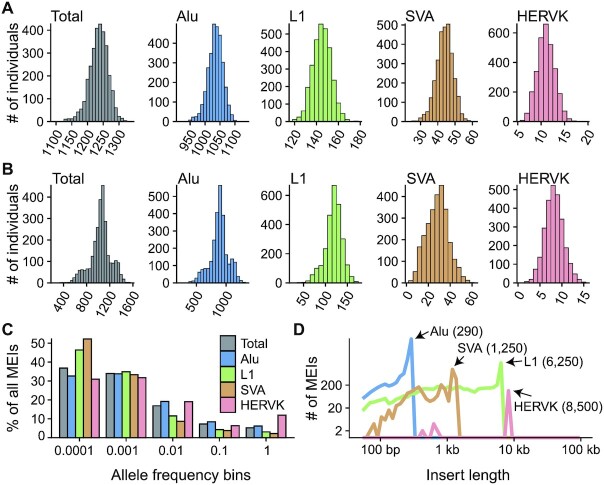
The MEI call set. (A) Histograms of the number of MEIs identified per genome in the NyuWa dataset. (B) Histograms of the number of MEIs identified per genome in the 1KGP dataset. (C) Distribution of allele frequency of MEIs of four types: Alu, L1, SVA and HERV-K. ‘Total’ combined the four types of MEIs. The allele frequencies were cut into five bins: 0 ≤ AF < 0.0001, 0. 0001 ≤ AF < 0. 001, 0. 001 ≤ AF < 0. 01, 0. 01 ≤ AF < 0. 1 and 0. 1 ≤ AF < 1 and the proportion of MEIs in each AF bin was calculated. (D) Distribution of insert size estimated by MELT. The x-axis coordinates of peaks were annotated.

