Figure 2.
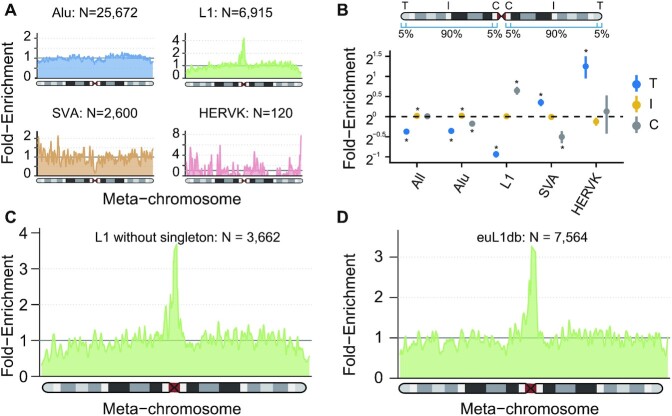
Chromosome-level Distribution of MEI Density. (A) Smoothed enrichment of different types of MEIs ascertained in this study. The values were calculated per 100 kb window across the average of all autosomes and normalized by the length of chromosome arms (as ‘meta-chromosome’). (B) Enrichment of MEIs by class and chromosomal context. The dots are the mean values and point ranges represent 95% confidence intervals (CIs). P-values were computed using a two-sided t-test and adjusted using the Bonferroni method. *P ≤ 0.05. C, centromeric; I, interstitial; T, telomeric. The way to compute the chromosomal enrichment and to represent data was from the gnomAD SV paper (18). (C) Smoothed enrichment of L1s with singletons excluded ascertained in this study. (D) Smoothed enrichment of non-reference L1s from the euL1db database (55).

