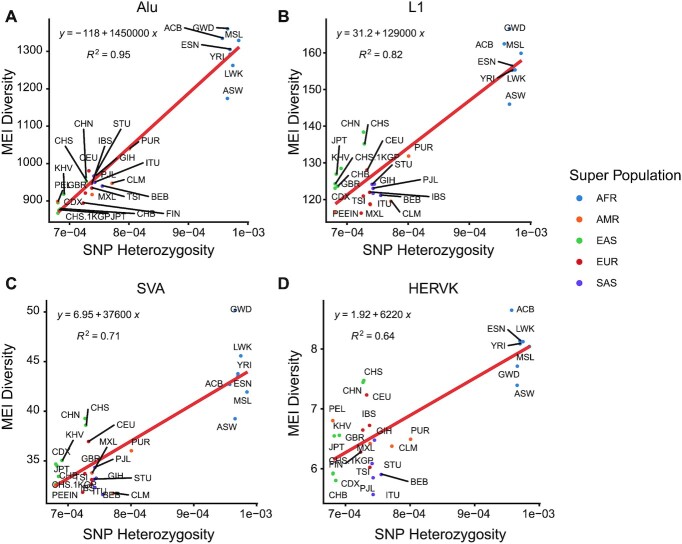
Figure 3.
Correlation between SNP heterozygosity and MEI diversity. SNP heterozygosities and diversity of (A) Alu MEIs, (B) L1 MEIs, (C) SVA MEIs and (D) HERV-K MEIs were compared in different populations. SNP heterozygosity was computed as the ratio of heterozygous SNPs across the individual’s genome and MEI diversity was computed as the average allele difference in each population. Points were colored by super populations. AFR, African super population; AMR, American super population; EAS, East Asian super population; EUR, European super population; SAS, South Asian super population.

