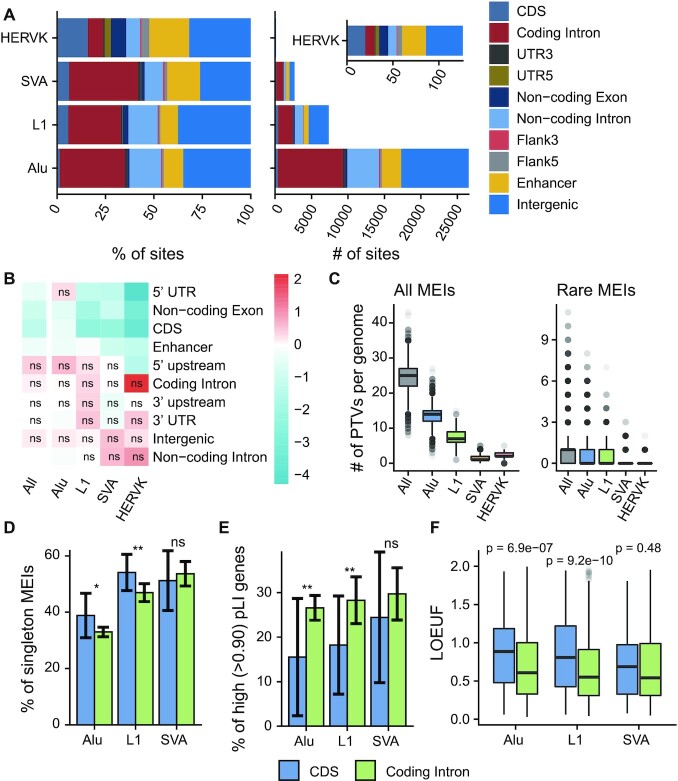
Figure 4.
MEI functional properties. (A) Predicted functional consequences for each type of MEI: (left) cumulative proportion, and (right) cumulative number. Coding Intron, introns of protein-coding genes; UTR5, 5′ UTR; UTR3, 3′ UTR; Non-coding Exon, exons of non-coding genes; Non-coding Intron, introns of non-coding genes; Flank5, 5′ flanking regions of genes; Flank3, 3′ flanking regions of genes. (B) Log2 fold enrichment of the MEI call set compared against the MEIs permutated. The permutation test was repeated 1000 times, and empirical P-values were commutated together with the enrichment values. The enrichment values were scaled row-wise. ns, not significant (P-value > 0.05). (C) Box plots of counts of predicted PTVs by MEI: (left) all the MEIs identified in this study, and (right) rare MEIs (allele frequency < 1%) in this study. (D) Proportions of singleton MEIs in CDS and coding introns for Alu, L1 and SVA. Error bars indicate 95% CIs based on population proportion. P-values were computed using chi-squared test. (E) Proportions of high pLI genes (pLI > 0.9) for genes with MEIs in the CDS and genes with MEIs intron regions. Error bars represent 95% CIs based on population proportion. P-values were computed using chi-squared test. (F) Box plots of LOEUF scores of genes with MEIs in the CDS and genes with MEIs in their introns. Wilcoxon rank sum test was used to compute p-values. Figure D-F uses the same legend beneath. ns, P ≥ 0.05; *P < 0.05; **P < 0.01.

