Figure 5.
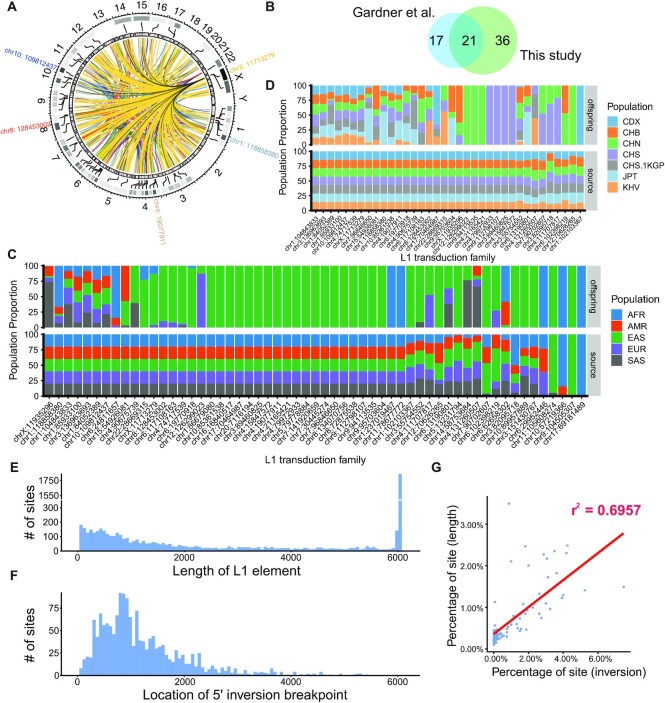
L1 3′ Transduction and 5′ Inversion. (A) 3′ transduction source-offspring relations across the whole genome. The heatmap denotes the offspring number. The top 5 sources with the highest numbers of offspring were marked outside the circle. (B) The Venn plot of 3′ transduction sources found by our study and the 1KGP study (16). (C) Source (bottom) and offspring (top) element frequencies in super populations. AFR, African super population; AMR, American super population; EAS, East Asian super population; EUR, European super population; SAS, South Asian super population. (D) Source (bottom) and offspring (top) element frequencies in Asian subpopulations. CDX, Chinese Dai in Xishuangbanna; CHB, Han Chinese in Beijing; CHN, Northern Han Chinese, China; CHS, Southern Han Chinese; CHS.1KGP, Southern Han Chinese from the 1KGP; JPT, Japanese in Tokyo; KHV, Kinh in Ho Chi Minh City. (E) L1 length distribution within our call set. The length was estimated by MELT. (F) 5′ inversion position distribution among all inverted sites. (G) Correlation plot between the distributions shown in (E) and (F). The full length L1 element was excluded from this comparison.

