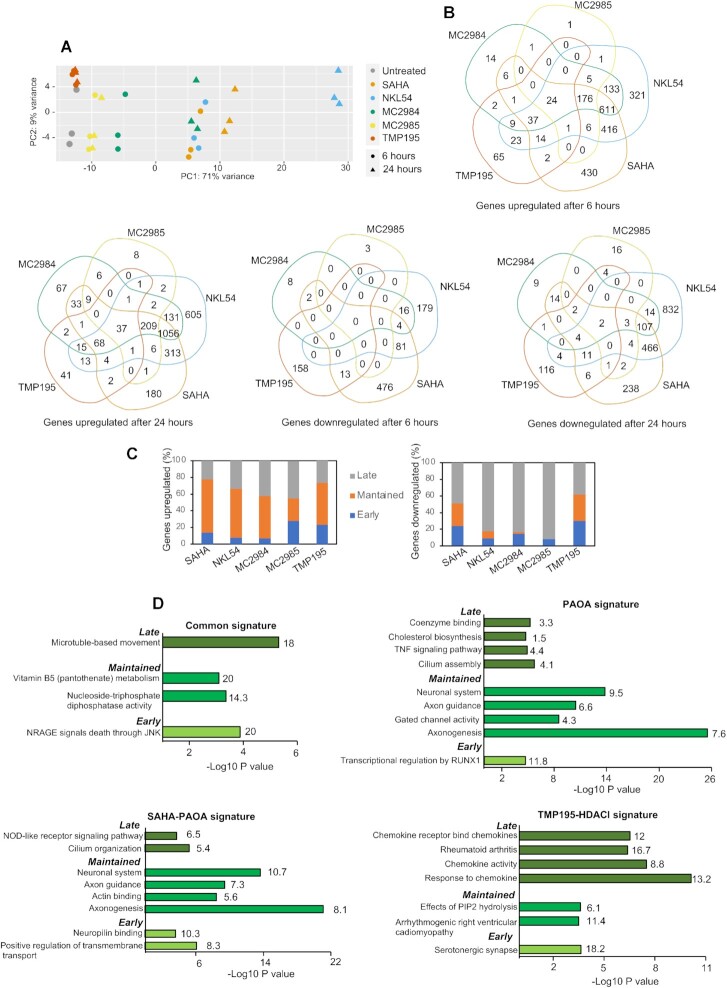
Figure 4.
Comparative transcriptomic analysis in response to the different HDACIs. (A) PCA analysis performed on the expression profiles of the indicated treatments at shown times in SK-UT-1 cells. (B) Venn diagrams showing the number of transcripts commonly and differentially upregulated or downregulated between the different HDACIs at the indicated hours. (C) Percentage of genes upregulated or downregulated by the different HDACIs at 6 h (early genes) at both 6 and 24 h (maintained genes) and at 24 h (late genes). (D) Bar plots of the ClusterProfiler-ReactomePA most significantly enriched functional terms according to the GO: Biological Process, GO: Molecular Function, Reactome or KEGG databases. The analysis was performed for the indicated groups of signatures, retaining the top terms for each functional database. Numbers to the right of the bars represent the percentage of significantly enriched genes found within each category.

