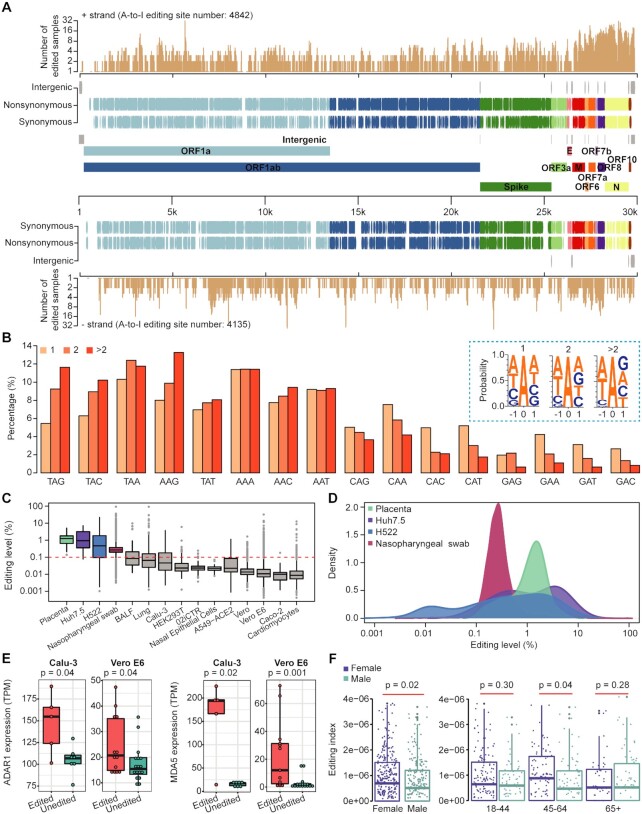
Figure 3.
The landscape of A-to-I RNA editing events in the SARS-CoV-2 genome. (A) Genic location and annotation of editing sites SARS-CoV-2. A-to-I editing sites in + and − strands were plotted separately. The number of edited samples at each editing site is indicated. (B) Comparison of triplet preferences for editing sites identified in one, two, or more than two samples. The triplets were ranked from preferred to disfavored triplets of ADAR1 based on a previous study (44). (C) Boxplot showing the editing levels of sites among samples. Only editing sites with coverage ≥30 were used for analysis. Note that for the lowly edited sites (e.g. with editing level < 0.1%), our calculations overestimated the editing level because G reads caused by sequencing errors were also counted as edited reads (see Materials and methods). Red line, sequencing error rate based on our quality cutoff (Q30). (D) Density plot showing the distribution of editing level in selected human samples. The four types of samples with the highest median editing levels in C were shown. (E) The relationship between editing levels and ADAR1 or MDA5 expression levels. Cell models infected with SARS-CoV-2 from two independent studies (Calu-3: PRJNA625518, Vero E6: PRJNA667051) were used for analysis. Samples were grouped based on their viral editing status, and then ADAR1 and MDA5 expression levels were compared. P-values were calculated using one-sided Mann−Whitney U-test. (F) Comparison of editing indexes between males and females. All individuals (left) or individuals of different ages (right) were analyzed. The editing index was calculated as described in the Materials and methods. P-values were calculated using one-sided Mann−Whitney U-test.

