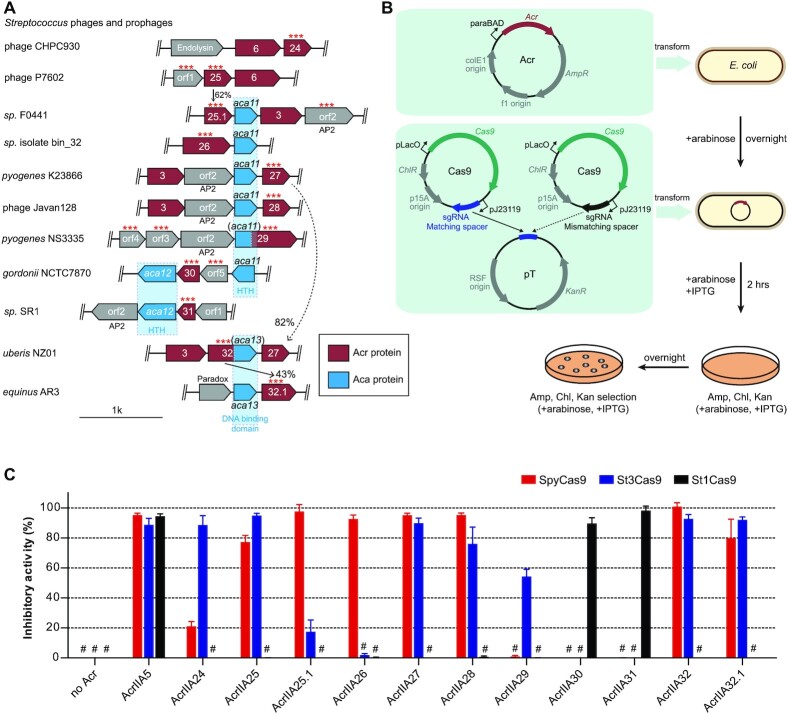
Figure 1.
Identification and validation of nine AcrIIA families from Streptococcus MGEs. (A) Schematic view of acr, aca and relevant neighboring genes in the genome of Streptococcus phages and prophages (see Supplementary Figure 1A for full schematic). Acr genes are shown in red with numbers corresponding to AcrIIA numbers. Arrows indicate the relationship between acr loci with the percentage of protein sequence identity. Aca genes are shown in blue with numbers and their predicted domains are displayed below. Helix–turn–helix (HTH) and AP2 DNA binding motifs were detected by HHpred (see the ‘Materials and Methods’ section). Other neighboring genes are shown in gray and some known genes are annotated according to the NCBI website. Individual genes (***) were assayed for CRISPR–Cas9 inhibition in E. coli; orf, open reading frame. (B) Schematic view of designed plasmids and procedure of plasmid interference assays for Acr activity analysis in E. coli. AmpR, ampicillin resistance; KanR, kanamycin resistance; ChlR, chloramphenicol resistance. (C) Bar graphs show the calculated inhibitory activity of each Acr against type II-A Cas9 orthologs (SpyCas9, St1Cas9 and St3Cas9) in E. coli. Inhibitory activity of each Acr was shown in percentage by calculating the ratio of cfu between E. coli transformed with Cas9 plasmid with matching spacer and that of the mismatching spacer. Experiments were repeated at least three times. The ‘#’ sign represents ‘below detection limit of this assay’. Each bar represents the mean ± SEM.

