Figure 1.
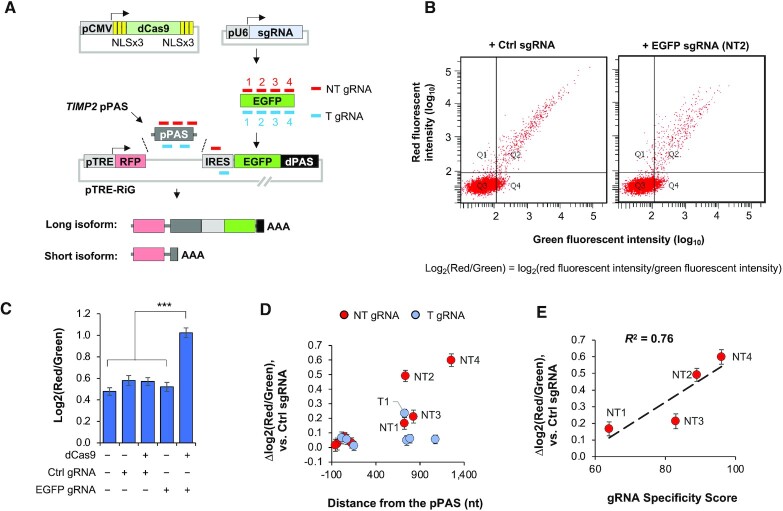
CRISPRpas alters 3′UTR PAS usage in a reporter construct. (A) Schematic of a reporter system to test CRISPRpas. mRNA expression of a dCas9 protein tagged with multiple copies of NLS is driven by a CMV promoter. A U6 promoter drives the expression of gRNAs that base-pair with either the non-template (NT) or template (T) strand of target DNA. gRNA target locations are indicated (not drawn to scale). The pTRE-RiG vector expresses a short isoform using the proximal PAS (pPAS) and a long isoform using the distal PAS (dPAS). TRE promoter is used for expression under the control of Doxycycline. Human TIMP2 proximal PAS was used as pPAS in the vector. dPAS is SV40 early PAS. AAA, poly(A) tail. (B) Representative images of flow cytometry data of HeLa Tet-On cells co-transfected with pCMV-dCas9, pTRE-RiG (TIMP2 pPAS) and gRNA-expressing vectors. Each dot is a cell. X and Y axes indicate green and red fluorescent intensity values, respectively. Log2(red/green) is calculated to indicate the relative red versus green fluorescent signals in each cell. (C) Comparison of log2(red/green) in different samples. ‘+’ and ‘−’ denote presence and absence, respectively. EGFP gRNA NT2 was used. Error bars are standard error of mean. ***, P < 0.001 (student's t-test). (D) Scatter plot showing distance of gRNA target site from the pPAS versus Δlog2(red/green) for eight NT and seven T gRNAs as compared to ctrl gRNA. Top five gRNAs based on Δlog2(red/green) are indicated on the plot. (E) Scatter plot showing gRNA specificity score versus Δlog2(red/green) for four NT gRNAs. gRNA Specificity Score is based on the CRISPOR program. R2 is indicated in the plot.

