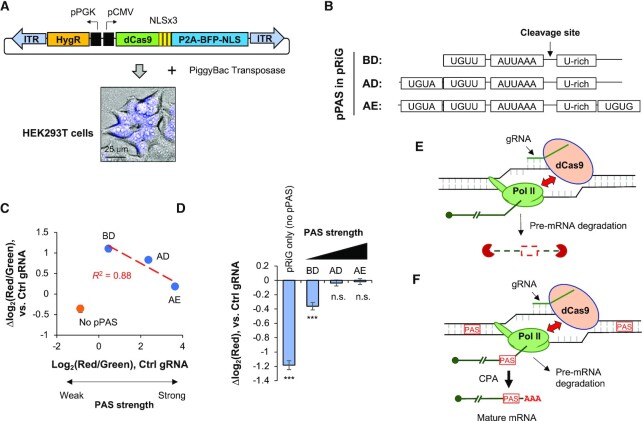
Figure 2.
PAS strength affects CRISPRpas efficacy. (A) Schematic of creating a stable HEK293T cell line expressing dCas9 using the PiggyBac transposase system. Top, the construct that expresses dCas9-NLSx3-P2A-BFP-NLS and hygromycin-resistant gene. P2A encodes a self-cleaving peptide, and BFP is blue fluorescent protein. ITR, inverted terminal repeat sequence used for genomic integration. Bottom, nuclear BFP signals detected by fluorescence microscopy in HEK293TdCas9 cells. A scale bar is shown. (B) Schematic of key motifs surrounding three PAS variants derived from the intronic PAS of human CSTF3, namely, BD, AD and AE. These PASs were used as pPAS in pRiG. (C) Scatter plot showing log2(red/green) using Ctrl gRNAs (indicating PAS strength) versus Δlog2(red/green) (indicating isoform change) by EGFP NT2 gRNA as compared to Ctrl gRNA in HEK293TdCas9. pPAS variants are indicated in (B). Linear regression line is for BD, AD and AE only. pRiG without pPAS is also indicated. (D) Bar graph showing Δlog2(red), which indicates red fluorescence in cells transfected with EGFP NT2 gRNA as compared to Ctrl gRNA. Significance of each bar compared to 0 is indicated (student's t-test). ***, P < 0.001; n.s., not significant. (E) A model for dCas9-mediated pre-mRNA degradation. When Pol II is stalled by dCas9, pre-mRNA is subject to degradation, either when associated with Pol II or after falling off from Pol II. (F) A model for dCas9-mediated APA regulation. When a gRNA targets a region between two PASs, pre-mRNA is subject to CPA at the proximal PAS (left one) when Pol II is stalled. It is also possible that some fraction of pre-mRNA is subject to degradation (also indicated). AAA, poly(A) tail.

