Figure 4.
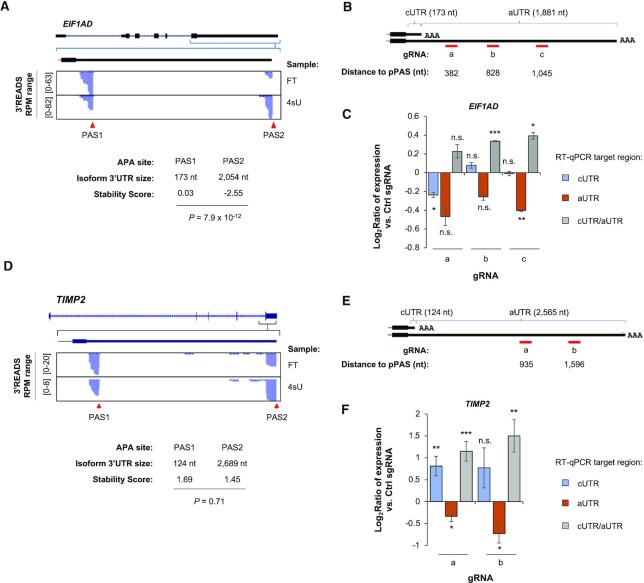
CRISPRpas modulates 3′UTR APA of endogenous genes. (A) UCSC tracks showing human EIF1AD gene structure (top) and 3′READS+ data for FT and 4sU fractions in the indicated region (bottom). 3′UTR sizes for the isoforms using the two APA sites and their Stability Scores are also shown. P-value (DEXSeq, n = 2) for Stability Score difference between the two isoforms is indicated. (B) Schematic of three gRNAs for EIF1AD. Distance to the pPAS is indicated (not drawn to scale). cUTR and aUTR are common UTR and alternative UTR, respectively. Their sizes are indicated. (C) RT-qPCR analysis result of relative amounts of cUTR (blue) and aUTR (orange) RNAs in HEK293TdCas9 cells transfected with indicated gRNAs (for 48 h). Data are normalized to those of Ctrl gRNA. The ratio of cUTR/aUTR RNA abundances is also indicated (gray). Error bars are standard error of mean (n = 2). P-value (student's t-test) for significance of difference from 0 is indicated. n.s., not significant; *, P < 0.05; **, P < 0.01; ***, P < 0.001. (D) As in (A), except that data for TIMP2 gene are shown. (E) As in (B), except that the values are for TIMP2. (F) As in (C) except that data for two TIMP2 gRNAs are shown. Error bars are standard error of mean (n = 6 and 4 for gRNA-a and gRNA-b, respectively).

