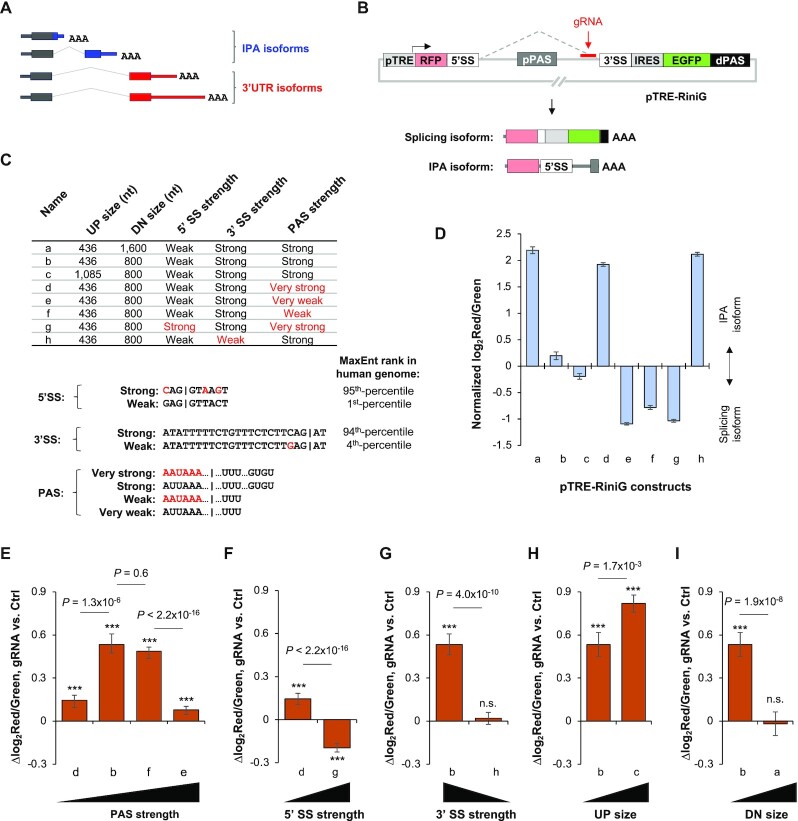
Figure 5.
CRISPRpas regulates IPA in a reporter system. (A) Schematic of IPA isoforms and 3'UTR isoforms, the latter of which use PASs in the last exon. (B) Schematic of pTRE-RiniG reporter construct to examine IPA regulation. The gRNA used is indicated (not to scale). 5′ splicing site (5′SS), 3′ splice site (3′SS) and pPAS were derived from human CSTF3 gene. Splicing isoform encodes RFP, IRES and EGFP sequences, whereas the IPA isoform encodes RFP and 5′SS. (C) A table summarizing pTRE-RiniG constructs with variable features. UP region is the region between 5′SS and pPAS, and DN region between 3′SS and pPAS. There are two variants for UP size, DN size, 5′SS type and 3′SS, respectively. There are four variants for the pPAS. Mutants of 5′SS, 3′SS and PAS are highlighted in red. The MaxEnt ranks for 5′SS and 3′SS are indicated. The vertical lines in 5′SS and 3′SS sequences indicate splice site. The vertical line in PAS sequence indicates cleavage site. ‘…’ in PAS sequence indicates sequence not shown. (D) Log2(red/green) for all pTRE-RiniG constructs transfected in HeLa Tet-On cells. This value indicates relative activities between IPA and splicing. (E–I). Bar graphs showing Δlog2(red/green) indicating isoform changes in cells transfected with target gRNA versus Ctrl gRNA along with various pTRE-RiniG vectors that differed in PAS strength (E), 5′SS strength (F), 3′SS strength (G), UP size (H) and DN size (I). The significance of difference of each value compared to 0 (no change) is indicated (student's t-test). n.s. not significant; ***, P < 0.01. P-values (Wilcoxon test) indicating significance of difference between bars are also shown.

