Figure 7.
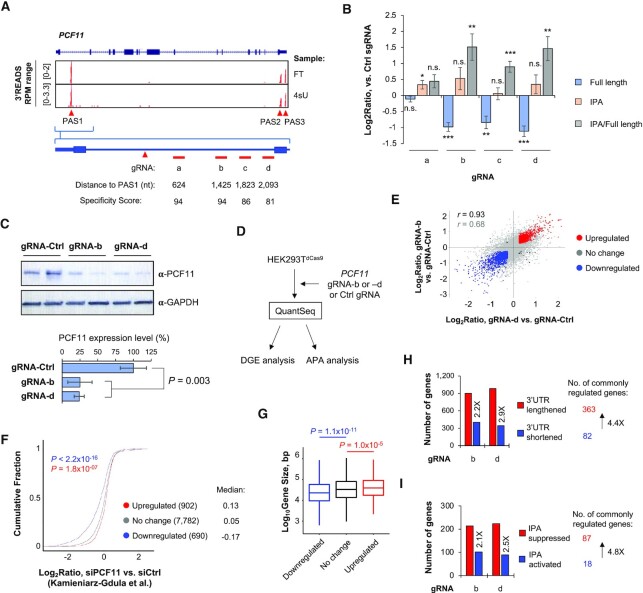
CRISPRpas regulates PCF11 expression through IPA. (A) UCSC tracks showing human PCF11 gene structure (top) and 3′READS+ data for FT and 4sU samples (middle). Intronic PAS (PAS1) and last exon PASs (PAS2 and PAS3) are indicated. Schematic showing gRNA target sites in intron 1 (a–d) are indicated at bottom. Their distances to PAS1 are also shown. (B) RT-qPCR analysis of relative amounts of full length (blue) and IPA isoforms (orange) in HEK293TdCas9 cells transfected with indicated gRNAs (24 h). Chemically synthesized gRNAs were used. Log2(ratio) of expression was normalized to Ctrl gRNA. The ratio of IPA to full length isoforms is also shown (gray). Error bars are standard error of mean (n = 3). (C) Western blot analysis of PCF11 protein expression in HEK293TdCas9 cells transfected with gRNA-b and gRNA-d (72 h after transfection). Expression was normalized to GAPDH. Quantification is shown at the bottom. Error bars are standard deviation (n = 2). P-value (t-test) is shown to indicate significance of difference in PCF11 expression between samples. (D) Schematic showing HEK293TdCas9 cells transfected with gRNA-b, gRNA-d, or Ctrl gRNA, followed by RNA sequencing by using the QuantSeq method. Data were subject to differential gene expression (DGE) analysis and APA analysis. (E) Scatterplot showing gene expression changes by gRNA-b (y-axis) versus by gRNA-d (x-axis). Significantly upregulated genes in both samples are shown in red, and those downregulated in both samples are in blue. Genes that are significantly regulated in only one sample are shown in black. Other genes are in gray. Pearson correlation coefficients are indicated for all genes (gray) and for commonly regulated genes (black). (F) Log2(ratio) of three gene groups in RNA-seq data from the Kamieniarz-Gdula et al. study, in which PCF11 was knocked down in HeLa cells. The three gene groups are red, blue and gray genes defined in (E). P-values (K-S test) are based on comparison of upregulated (red) or downregulated (blue) genes with no change (gray) genes. (G) Box plots of gene size (bp, log10) in three gene groups as defined in (E). P-values (K-S test) are based comparison of upregulated (red) or downregulated (blue) genes with no change genes. (H) 3′UTR APA analysis using MAAPER. Two QuantSeq samples were analyzed individually. The number of genes showing lengthened 3′UTRs (red) or shortened 3′UTRs (blue) are indicated. Commonly regulated genes between two samples are shown, which indicates a global trend of 3′UTR lengthening (genes showing lengthening outnumber those showing shortening by 4.4-fold). (I) As in (H), except that IPA analysis result using MAAPER is shown. The number of genes showing suppressed IPA (red) or activated IPA (blue) are indicated. This result indicates global IPA suppression (genes showing IPA suppression outnumber those showing activation by 4.8-fold).

